
Adrian Kavanagh, 19th November 2013
This post looks at voter turnout levels in the recent Seanad and Court of Appeals referendum contests, making specific reference to turnout differences at the Dail constituency level but also to turnout differences (based on electoral division-level figures) within the Dublin City area (or rather the six Dail constituencies administered by the Dublin City Returning Officer).
Some of you may be aware that I am mainly an electoral geographer. What makes me different from political scientists? Well my main focus in studying electoral trends and behaviour is on studying how trends and behaviours differ between areas, or places, and as a result my main unit of analysis tends to be electoral data drawn from different areas (or constituencies) whereas political scientists would tend to mainly rely on data from surveys. The geographical perspective allows analyses to take account of all the views of the electorate – albeit with these being aggregated together to produce area-based electoral statistics –whereas surveys can only take account of the views of very small proportions of the electorate. The geographical approach also allows one to take account of the impact of context on political behaviour, which is vitally important given that political behaviour, as argued by John Agnew, is very much place-based. Of course, there are only certain questions that may be answered using such area-based analysis with the main limits relating to a lack of data relating to certain questions (e.g. questions that may not be covered in the Census) and the material offered from other sources, such as surveys or interviews, is necessary to address such deficits. As such, the different approaches favoured in electoral analyses by electoral geographers and political scientists can be seen to complementary and not in competition with each other.
In light of this, in this post I will be studying the geography of voter turnout at the recent Seanad and Court of Appeal Referendum contests, with a specific focus on turnout trends in the DublinCity constituencies. As you may remember, there was significant concern about – and media focus on – the low voter turnout level for these referendum contests. A geographical perspective highlights the fact that there were notable differences in turnout levels across the state and within specific constituencies or regions, such as the DublinCity constituencies’ area. This may suggest that an area-based approach, focusing specifically on areas of very low turnout, such as Donegal (in the case of referendum contests) or the areas of cities with the highest levels of social deprivation and/or residential mobility, may be best utilised to address low electoral participation issues should sufficient political motivation arise to allow such issues be effectively addressed.
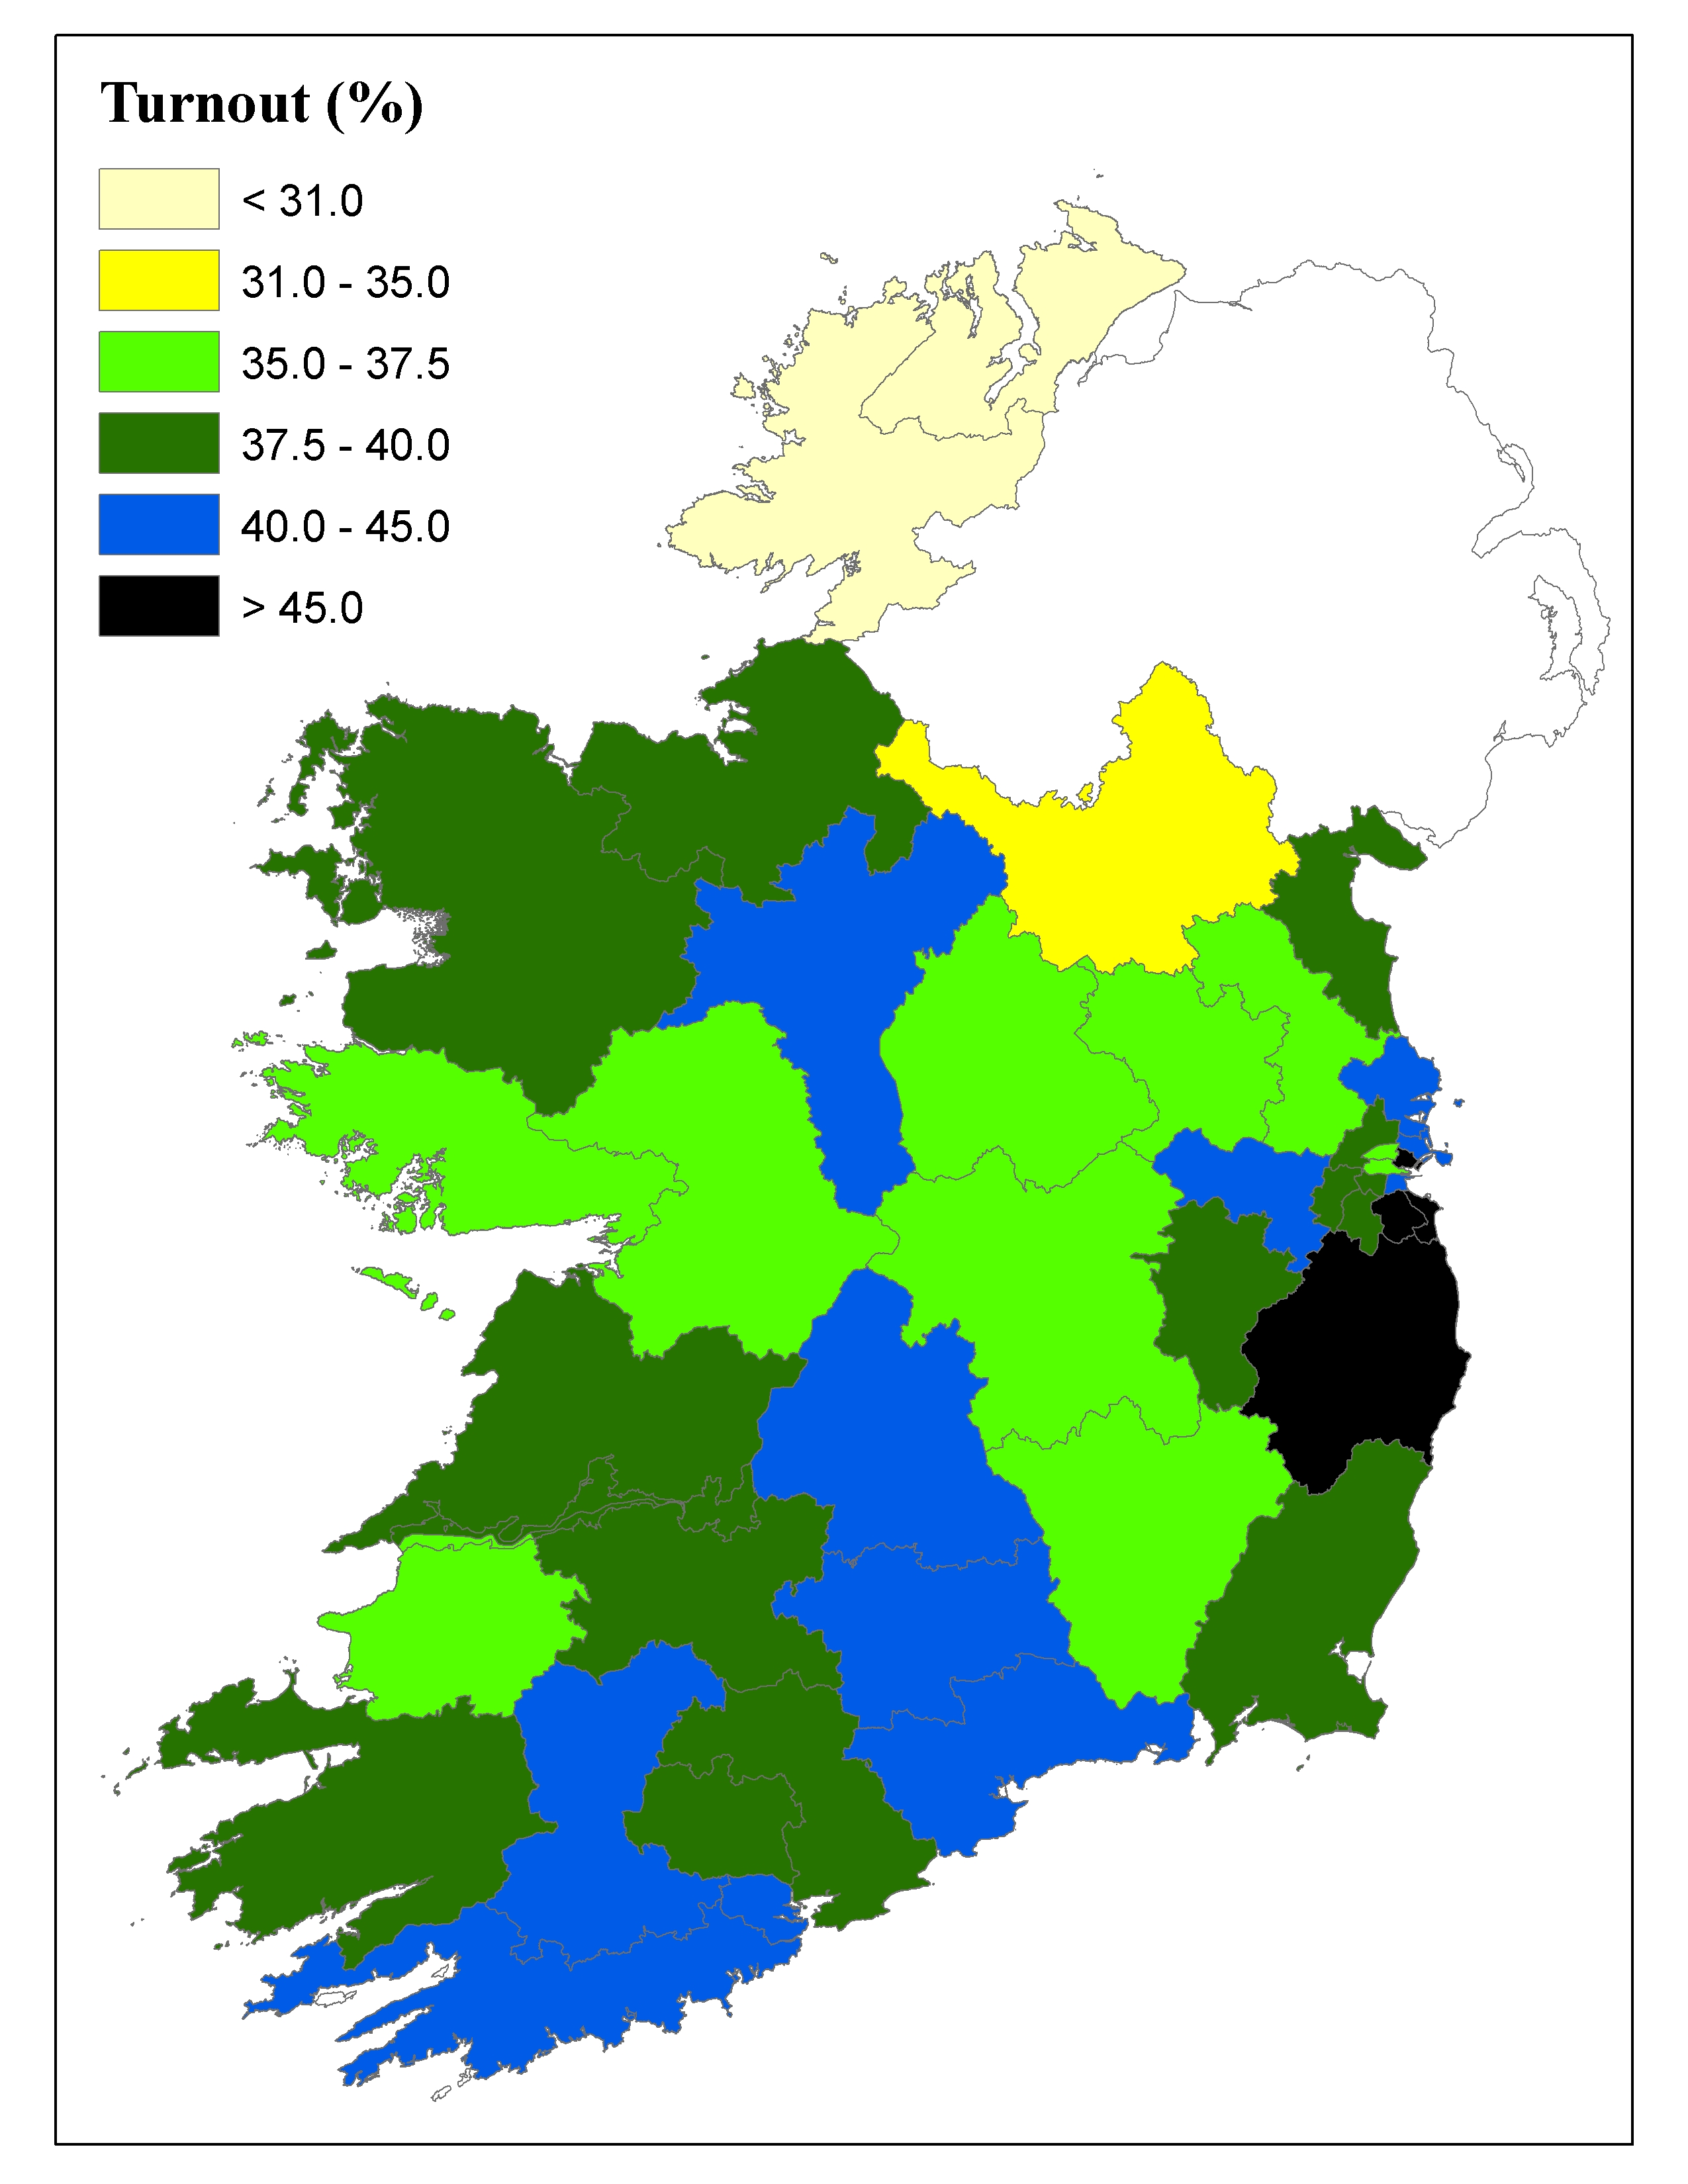
Figure 1: Voter turnout (%) by Dail constituency for the 2013 Seanad Referendum
The national average turnout level for the 2013 Seanad Referendum was 39.23% (the turnout level for the other referendum on the Court of Appeal) was 39.15%), but this masks significant variations across the state at the (Dáil) constituency level, as shown by Figure 1 above. The highest turnout level was associated with the Dublin North-Central constituency (48.20%), with notably higher than average turnout levels also being associated with the Dún Laoghaire (46.16%), Dublin South (45.96%) and Wicklow (45.09%) constituencies. By contrast, the lowest referendum turnout levels were associated with the two Donegal constituencies – Donegal North-East (29.24%) and Donegal South-West (30.47%) – and Cavan-Monaghan (34.48%). Given that voter turnout levels in these constituencies tend to be around, or even well above, the national average for local and general elections, issues to do with low electoral participation in this case seem to be specifically to do with referendum elections. This would especially be the case with the two Donegal constituencies, which in recent decades have usually tended to have the lowest turnout levels in the state for referendum elections. There are some areas, however, which had low turnout levels at this contest and which also tend to have low voter turnout levels for other types of electoral contests, as will be evidenced in the next section.
Constituency level figures do give a sense as to certain trends in relation to electoral behaviour in Ireland, but especially in relation to urban-rural trends in relation to factors such as party support and voter turnout. However, in many cases the more dramatic and interesting differences exist within constituencies and hence cannot be picked up in terms of a constituency level analysis. There are also issues in terms of statistical analyses with the relatively small number of cases involved in terms of Irish Dáil constituencies (forty three at the last general election, forty at the next general election). Data for sub-constituency units, such as electoral divisions or polling districts, is hence very much desired, but unfortunately election figures are only made readily available at the constituency level. Data at the constituency level may be gleaned from other sources, however, such as tally figures (which are published in some local newspapers after local and general elections) to cover party support and ballot reconciliation figures (available in some instances from the constituency returning officers) to cover voter turnout. In these instances, a bit more in the way of analysis may be required to translate the figures into a format that might be more suitable for the purposes of mapping or statistical analyses (e.g. involving Census figures), such as electoral division-level figures.

Figure 2: Voter turnout (%) at the electoral area at the 2013 Seanad Referendum for the Dublin City constituencies
In this instance, the Dublin City Returning Officer thankfully publishes voter turnout figures by polling box for elections usually a few weeks after these have taken place, Using this excellent resource, I can then, with some further analysis, transform these into electoral division-level figures, thus allowing me to map the turnout data, as I have been able to do for the recent Seanad Referendum contest. The resulting map of voter turnout (Figure 2) shows notable class differences in turnout levels, with the highest turnout levels being generally associated with the more middle class areas in the area covered by Dublin City constituencies (which also includes areas falling outside of the Dublin City area, such as Howth and Portmarnock in Fingal and the Kimmage Manor area in South Dublin County) with lower turnout levels associated with the more working class areas. There is also a noticeable influence associated with residential mobility and residential stability: areas characterised by high levels of residential mobility tend to have lower than average turnout levels, while higher levels tend to be associated with areas with higher degree of residential stability. Given these trends, it is hardly surprising that the most obvious cluster of low turnout in this area tends to be associated, as in all recent electoral contests, with the Dublin Inner City.

Figure 3: Average voter turnout levels (%) by Social Areas in Dublin City for elections between 2009-2013
To tease out the link between class and turnout here, I have divided up the electoral divisions located within this area across five different Social Areas, based on a principle components analysis of different Census 2011 variables linked to levels of social affluence/deprivation (e.g. percentage of people living in local authority housing, percentage of lone parent households, percentage unemployment rate). Rank 1 area would have the 20% highest scores in the Dublin City constituencies area, i.e. the 20% most affluent areas, with the Rank 2 area referring to the next 20% highest and so on until the Rank 5 areas. These would have the 20% lowest scores in the Dublin City constituencies area, i.e. include the 20% most deprived electoral divisions in this study area. As Figure 3 shows, this analysis points to a strong relationship between class/social well-being and turnout levels, with the highest average turnout levels for all these elections being associated with the Rank 1 areas/electoral divisions and with the turnout levels declining as one moves from the more affluent ranks and into the less affluent ranks. What is especially interesting, looking at the degree of turnout differences between the different ranks, is the suggestion that class seems to have had different levels of influences across these different contests. The data presented in Figure 3 would suggest that – for the Dublin City constituencies area at least – that class had a particularly strong effect in shaping turnout differences for the 2013 Seanad Referendum contest, not only in relation to the 2011 General Election but also in relation to some of the other more recent referendum contests. For instance, in comparing turnout trends with last year’s Children’s Referendum it can be seen that turnout levels at the Seanad Referendum in the more affluent areas (the Rank 1 and Rank 2 areas) were on average roughly seven to eight percent higher than in the Children’s Referendum. But the degree of turnout increase between these two referendum contests in the more socially deprived areas (Rank 4 and rank 5 areas) was relatively small, by comparison. This, this points to an especial widening of class-based turnout differences within Dublin City at the 2014 Seanad Referendum contest.
