
Adrian Kavanagh, 30th May 2013
Thursday 30th May 2013 saw the publication of the Local Electoral Area Boundary Committee Report 2013, which outlines the constituency boundaries for next year’s local elections (May 2014). The committee faced a very difficult task, in fairness, given that the levels of change being determined by the terms of reference would probably amount to the most dramatic redrawal of local election constituency boundaries in the history of the State.
The number of members of local authorities was to be dramatically reduced with the abolition of town councils/urban district councils – which was to be compensated for somewhat by a relatively small increase in the overall number of County/City councilors. Perhaps even more dramatic change to be taken account of were the decision to allocate between between 6 and 10 councilors/seats to each of the new electoral areas (a significant increase on the 4-7 seat range that the previous 2008 committees had to choose from) and the decision to reallocate councilor numbers across the different local authorities.Some local authority areas stood to attain increased levels of local representation, as a result of this, but councilor numbers would decline dramatically in other parts of the State. Another change factoring into these changing councilor levels was the decision to amalgamate a number of local authority areas – Limerick City and Limerick County, Waterford City and Waterford County, Tipperary North Riding and Tipperary South Riding.
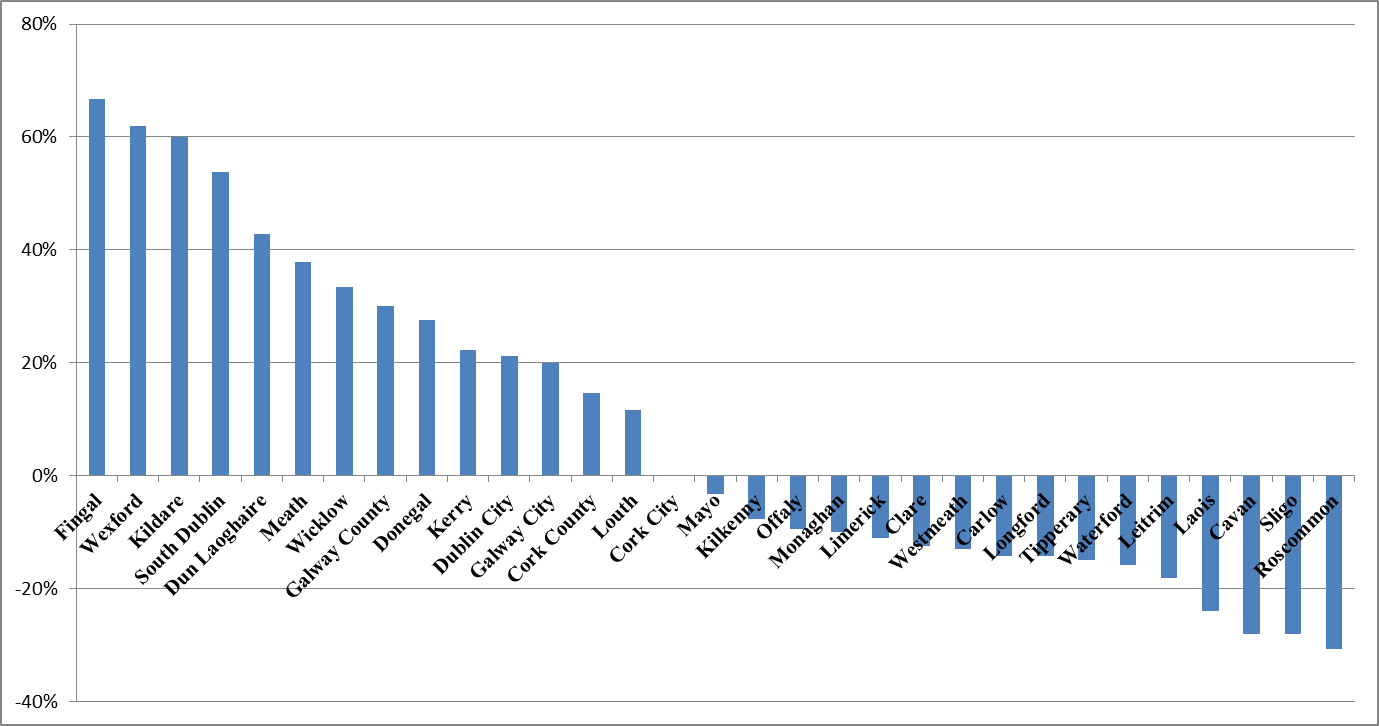
Percentage change in councilor numbers by City/County Council area, 2008-13
The above chart shows that the biggest percentage increase in City/County councilor numbers tended to occur in the local authority areas located in the Dublin region and in eastern parts of the state, as well as in some of the other larger counties such as Cork County, Donegal and Kerry. By contrast, the biggest percentage decrease in City/County councilor numbers tended to be associated with the smaller, more rural counties, located in the West and Midlands regions, as well as in the new amalgamated council areas. Fingal (67%) enjoyed the biggest percentage increase in councilor numbers, followed by Wexford (62%), Kildare (60%), South Dublin (54%), Dun Laoghaire-Rathdown (43%) and Meath (38%). By contrast, the biggest percentage loss in councilor numbers was experienced by Roscommon (-31%), followed by Sligo (-28%) and Cavan (-28%), while Laois would lose 24% of its number of county councilors despite that county experiencing the biggest percentage increase in population at the 2011 Census.
The overall number of County/City Councillors were to increase from 883 to 949, although 774 positions on borough and town councils were being abolished (some of these positions of course were held by people who were also county councilors), making for a 7% increase in the number of these nationally. However, where the loss of the borough and town councilors was factored in, local representation levels were seen to drop from an overall level of 1,627 to 949, amounting to a 42% decline in these. When the loss of borough and town councilors was factored in, the level of losses experienced by rural counties in relation to local representation levels became even more dramatic, as shown in the chart below. In this instance, while Dublin and Galway City is still seen to gain in terms of local representation levels, some rural counties are seen to have experienced a drop of over 50% in their overall representation levels (including Monaghan, Cavan, Cork County, Tipperary, Offaly, Clare, Laois, Longford, Carlow, Sligo, Westmeath, Louth and Waterford).

Percentage change in local representation levels by City/County Council area, 2008-13
With the increase in the number of seats being allocated to the new electoral areas, the overall number of local election constituencies in the state was to decrease from 171 to 137. As such, the average number of councilors per electoral area would increase from 5.16 in the 2008 revisions to 6.93 in the 2013 revisions, marking a significant increase in the overall district magnitude levels. In all, there are now sixty six 6-seat electoral areas, twenty three 7-seat electoral areas, twenty three 8-seat electoral areas, thirteen 9-seat electoral areas and six 10-seat electoral areas.
This factor will be a significant element in terms of shaping the political landscape of next year’s local election contests. The larger constituency sizes may assist in allowing for higher levels of female candidatures and representation at a local level based on insights from some earlier posts on this site, as well as allowing for the local representation of minority groups in some parts of the state. While the bigger seat sizes may seem likely to advantage/disadvantage certain parties, the tendency for people to vote even more local then in they do in general elections may mean that this is not as significant a factor as it would be if the number of seats attached to general election constituencies was increased.
One other major change in the terms of reference set for this committee was the decision not to require it to try to ensure conformity between the boundaries of the new local election constituency units and the new general election constituencies as set out in last year’s Constituency Commission report. This was, in my opinion, a mistake as the level of boundary changes involved in the 2012 Constituency Commission and Local Electoral Area Boundary Committee Report 2013 reports would make for some confusion on the part of voters in terms of what constituencies they would be voting in, but mismatches between local and general election boundaries would further add to this confusion. There were some instances in which the committee explicitly did try to keep the local election boundaries in line with the new general election boundaries created in the 2012 Constituency Commission report, as in the case of Dublin City, but generally this does not seem to be the practice employed for most counties in this report.
As such the 2013 committee had a much more difficult and challenging ranges of changes and issues to factor in than the previous committees in 2008 had to face. The committee also was to cover the entire state (with the exception of Cork City), whereas the work of the 2008 revisions had been taken on by two separate committees – one to focus on Dublin and (other) City Council areas and the other to focus on the County Council areas (excluding Fingal, South Dublin and Dun Laoghaire-Rathdown). The level of work that the Committee had to face was attested to by the fact that this committee had to meet on 15 occasions during its terms – the number of meetings required for the two committees in 2008 was decidedly much lower. The limited amount of time precluded the opportunity to try and tease out the rationale at a more local level behind different boundary line options, for instance. (If the committee had more time, I would prefer that a series of options (say three) in terms of local electoral area constituency boundaries within a county be presented first and before the public submissions process opened up. This would make it easier for the people making the submissions to make more meaningful comments, especially in the context of such dramatic revisions as the 2013 committee faced, but also allow people making the submissions to “local proof” the draft proposals – i.e. to note cases where proposed boundaries did not make sense from a local’s perspective.)
It is perhaps not surprising, given the amount of work involved and the limited time to complete the job, that some of the Committee’s proposals are likely to promote some degree of controversy locally in different counties. To a large degree, this is a knock on effect of the increase in the number of seats per electoral area – especially in the less densely populated rural counties, the creation of a 6+ seats electoral area is always going to necessitate some strange bedfellows. But there are instances, as noted above, where some concerns could have been addressed if the Committee had enough information to sufficiently “local proof” their proposals – unfortunately, public submissions are often not framed in a way that can help the Committee in relation to this, especially in this instance as many submissions were being effectively “made in a vacuum” given the levels of changes being encompassed in this review.
Given the terms of reference set for the Committee and especially the problems faced in drawing up constituency units with six, or more, seats in low density, rural counties, it is perhaps not surprising that there are some rather large, and also some rather unusually shaped, electoral areas. The Baltinglass electoral area in west Wicklow is perhaps the constituency unit that most resembles Governor Gerry’s famous salamander, although it probably best resembles an inverted sea-horse. The South And West Kerry electoral area covers a very large geographical area, which encompasses all of the Kerry peninsulas but in which the Dingle peninsula is joined to the rest of this electoral area only by a very narrow strip of land.

Still Fingal is under represented. Previously we had 10,000 population per councillor. Now they have capped the number of councillors at 40 for Fingal which leaves it better off than the current numbers but still under represented. There should have been an increase to 57…meanwhile the population of Fingal grows…
A very good summary of the position. A couple of comments though. It is unsatisfactory that the committee did not have regard to Dail boundaries but of course it was not in the terms of reference. They did at least manage to keep the substantial stray bits of Donegal, Mayo, Kildare, Meath, Westmeath and Tipperary in other Dail constituencies together, but failed to do this for the stray bit of Cavan. In reality outside Dublin Dail boundaries are really only an issue in Meath, Kildare, Galway Limerick and Cork these days and in some cases it is those that are illogical.
Another huge problem with the terms of reference was that it did not allow for exceptional 5 and 4 seat areas. This would have solved the Baltinglass and Kerry peninsula problem you refer to. The last time there was an exception for three and the committee confined its use to precisely those two areas and to Bandon.
Another thought I had and forgot. It is clear that logical submissions from particular areas were taken into account. These included the submissions re Donnybrook, Sandymount, Swords/Malahide and Terenure in Dublin and submissions re Bunclody in Wexford and rural areas west of Killarney. It would be wonderful if the committee when putting these on website could put numerous similar submissions in their own category so that those of us following substantive new submissions don’t need to open them.
Reblogged this on irishonlineradio and commented:
Another great analysis piece by Adrian Kavanagh, this one on the Local Electoral Area Boundary Committee.
Pingback: Seanad Elections 2016 – A Final Overview | Irish Elections: Geography, Facts and Analyses