
Adrian Kavanagh, 29th May 2017
There is little more than a week left now until the general election that is scheduled to be held in the United Kingdom on Thursday 8th June 2017.
What do the latest opinion poll figures suggest in relation to the likely number of seats that each party will win in that contest? The opinion polls across the last few weeks of the campaign have shown Labour gaining significant ground on the Conservatives, albeit not to such an extent that these improved Labour fortunes seem likely to prevent the Conservatives winning another majority in the House of Commons after the June 8th election. Both of the two largest parties, as of now, are well ahead of the support levels that they won at the 2015 General Election, meaning that the smaller parties are at risk of being squeezed out.
As the last general election in the United Kingdom showed, estimating seat levels for the House of Commons elections is a hazardous task to engage in, as the votes to seats ratio will be skewed by geography and spatial differences in terms of support gains/losses for different parties. For instance, Labour’s overall share of the vote increased in 2015, relative to the 2010 General Election, by 1.5%, but the extent of the party’s support/seat losses to the Scottish National Party in Scotland (returning with just 1 of the 41 seats that the party had won there in 2010) meant that most of the 701,147 votes won by Labour in Scotland were effectively wasted votes.
For the purposes of this analysis, I have averaged out the estimated support levels for the five political parties in the United Kingdom (Conservatives, Labour, United Kingdom Independence Party, Liberal Democrats and the Green Party) that are covered in all of these polls. As no consistently accurate poll figures are presented here for the regional parties, or for the very small parties, I have assumed – for the purposes of this model – that support levels for these parties/groupings will remain “as was” relative to the 2015 contest. Averaging out the party support estimates in the most recent YouGov/Times, Kantar, ICM/Guardian, Survation/Mail on Sunday, ORB/Sunday Telegraph, Ipsos-MORI-Evening Standard, Opinium/ opinion polls (as published on the UK Polling Report website) estimates support levels for these five parties to stand as follows: Conservatives 45.6% (up by 8.7% relative to 2015), Labour Party 34.2% (up by 3.8% relative to 2015), United Kingdom Independence Party 4.1% (down by 8.5% relative to 2015), Liberal Democrats 9.0% (up by 0.3% relative to 2015) and Green Party 2.2% (down by 1.6% relative to 2015).
I have separately factored in the results of the latest Scottish regional opinion poll (the YouGov/Sunday Times poll of 19 May) into the support/seat estimate figures for the 59 Scottish constituencies. This poll estimated support levels for the five aforementioned parties and the Scottish National Party as follows: Scottish National Party 42% (down by 8.0% relative to 2015), Conservatives 29% (up by 14.1% relative to 2015), Labour 19% (down by 5.3% relative to 2015), United Kingdom Independence Party 1% (down by 0.6% relative to 2015), Liberal Democrats 6% (down by 1.5% relative to 2015) and Green Party 2% (up by 0.7% relative to 2015).
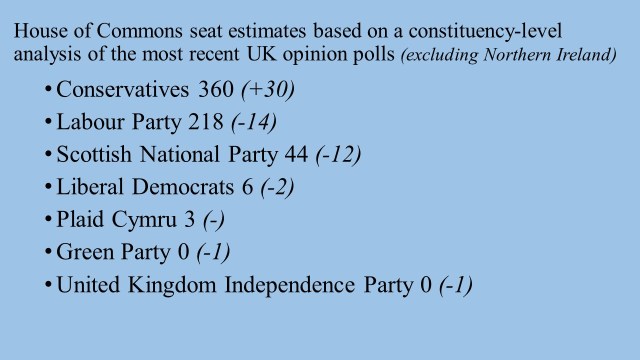
Using the same constituency-level analysis model that I employ to study the likely impact of Irish opinion poll figures on Dail-seat estimates, I estimate the following number of seats would be won by these parties – and other parties in England, Scotland and Wales – in June 2017, should the latest opinion poll figures be replicated exactly at the general election contest (As noted below, I also apply the figures in the most recent Scottish regional poll to generate separate support/seat estimates for the 59 Scottish constituencies): Conservatives 360 (up by 30 seats relative to 2015), Labour Party 218 (down by 14 relative to 2015), Scottish National Party 44 (down by 12 relative to 2015), Liberal Democrats 6 (down by 2 relative to 2015), Plaid Cymru 3 (NC relative to 2015), Green Party 0 (down by relative to 2015) and United Kingdom Independence Party 0 (down by 1 relative to 2015).(As the national-level opinion poll figures seem to largely ignore Northern Ireland, I cannot factor in support/seat estimates for the political parties in Northern Ireland into this analysis, unfortunately.)
Improving poll fortunes for Labour over the past few weeks have seen the party now exceeding the level of support that they had at the 2015 election by a margin of almost four percentage points. The Liberal Democrats are slightly ahead the suppoer levels that they won in 2015, although this party has lost some ground across the opinion polls held in recent weeks. The extent of the swing to the Conservative Party, as measured in the most recent opinion polls, would see both of these parties losing seats to the Conservatives if these poll figures were to be replicated at the real election on 8th June. The Green Party and the United Kingdom Independence Party, by contrast, would see an overall loss in their national support levels if the most recent poll figures were replicated at the June 8th contest. Both parties would be expected to lose the one seat that they won in 2015 based on these figures. It it worth noting that the Greens held their seat in Brighton Pavilion in 2010 on much smaller share of the national vote (0.9%) that the level they held when they retained that seat in 2015, but also a smaller national vote share relative to where they current stand in the national opinion polls. However, recent shifts in the national opinion polls suggest that that this seat has become increasingly marginal and vulnerable to a gain by the Labour Party (as suggested in this analysis) or the Conservatives.
The model predicts that the Conservative Party would gain seats in the following 30 constituencies:
| Angus |
| Banff & Buchan |
| Barrow & Furness |
| Berwickshire, Roxburgh & Selkirk |
| Brentford & Isleworth |
| Carshalton & Wallington |
| Chester, City of |
| Clacton |
| Dewsbury |
| Dumfries and Galloway |
| Ealing Central and Acton |
| East Lothian |
| East Renfrewshire |
| Edinburgh South |
| Edinburgh South West |
| Enfield North |
| Halifax |
| Hampstead and Kilburn |
| Hove |
| Ilford North |
| Lancaster and Fleetwood |
| Moray |
| Newcastle-under-Lyme |
| Ochil and South Perthshire |
| Perth and North Perthshire |
| Southport |
| Stirling |
| West Aberdeenshire & Kincardine |
| Wirral West |
| Wolverhampton South West |
A number (roughly half) of these gains would be made at the expense of the Labour Party, but a large proportion of these gains would also come at the expense of the Scottish National Party, with gains also being made at the expense of the United Kingdom Independence Party (Clacton), and the Liberal Democrats (Carshalton & Wallington and Southport), should the support/seat estimates in this analysis pan out in the actual general election on 8 June 2017.
The model predicts that Labour would lose seats in the following fifteen constituencies, with all of these losses being made to the Conservatives:
| Barrow & Furness |
| Brentford & Isleworth |
| Chester, City of |
| Dewsbury |
| Ealing Central and Acton |
| Edinburgh South |
| Enfield North |
| Halifax |
| Hampstead and Kilburn |
| Hove |
| Ilford North |
| Lancaster and Fleetwood |
| Newcastle-under-Lyme |
| Wirral West |
| Wolverhampton South West |
However, the analysis also suggests that Labour would make one gain at the expense of the Green Party – the analysis predicts that Labour would win the constituency of Brighton Pavilion, should the support/seat estimates in this analysis pan out in the actual general election on 8 June 2017.
As noted above, I have factored in the results of the most recent Scottish regional opinion poll (the YouGov/Sunday Times poll of 19 May) into the support/seat estimate figures for the 59 Scottish constituencies. This poll estimates support levels for the five aforementioned parties and the Scottish National Party as follows: Scottish National Party 42% (down by 8.0% relative to 2015), Conservatives 29% (up by 14.1% relative to 2015), Labour 19% (down by 5.3% relative to 2015), United Kingdom Independence Party 1% (down by 0.6% relative to 2015), Liberal Democrats 6% (down by 1.5% relative to 2015) and Green Party 2% (up by 0.7% relative to 2015). These support/seat estimate figures suggest that the Conservatives would make gains in Scotland at the expense of the Scottish National Party in the following constituencies if these support figures were to be replicated at the June 8th election across the 59 Scottish constituencies: Angus, Banff & Buchan, Dumfries & Galloway, East Lothian, East Renfrewshire, Edinburgh South-West, as well as Berwickshire, Roxburgh & Selkirk, Moray, Ochill and South Penrithshire, Perth and North Perthshire, Stirling and West Aberdeenshire & Kincardine. The Conservative Party in Scotland would also be predicted to gain Edinburgh South at the expense of Labour on the basis of the party support estimates relating to the YouGov/Sunday Times poll.
How this model works: As with my analyses of opinion poll figures in Ireland, constituency support estimates for different parties and groupings form the basis of the general approach taken with this analysis. This approach seeks to ask the following question in relation to different opinion poll results – what do these poll figures mean in terms of the likely number of House of Commons seats that could be won by the different parties and groupings on those national support levels? As the electoral system employed in the United Kingdom is most definitely not a proportional electoral system, the proportion of seats won by parties will not measure up exactly to their actual share of the first preference votes. Geography will have a very significant impact here, while first past the post electoral systems, such as the one used in the United Kingdom, will always act to the advantage of the largest parties and will significantly disadvantage the smaller parties, unless their votes are strongly clustered in a specific geographical region – e.g. Scotland, Wales or Northern Ireland.
First preference votes need to be filtered through the system of the United Kingdom’s general election constituencies . In order to address the question, I estimate what the party first preference votes would be in the different constituencies, assuming similar (proportional) changes in party vote shares in all constituencies to those that are being suggested by a particular opinion poll, or – in this case – an average of the most recent polls. This of course is a very rough model and it cannot take appropriate account of the fact that changing support levels between elections tend to vary geographically 9as occurred in the 2015 contest). Thus constituency support estimates for different parties/groupings will be over-estimated in some constituencies and under-estimated in others, but the expectation would be that the overall national seat figures figures estimated will be relatively close to the true level, given that over-estimates in certain constituencies will be offset by under-estimates in others. Based on these estimated constituency support figures, I proceed to estimate the destination of seats in the different constituencies. Due to unusually high/low support levels for some parties or political groupings in certain constituencies in the previous election, the model may throw up occasional constituency predictions that are unlikely to pan out in a “real election”, but of course the estimates here cannot be seen as highly accurate estimates of support levels at the constituency level as in a “real election” party support changes will vary significantly across constituency given uneven geographical shifts in support levels.
The point to remember here is that the ultimate aim of this model is to get an overall, national-level, estimate of seat numbers and these are based, as noted earlier, on the proviso that an over-prediction in one constituency may be offset by an under-prediction in another constituency. This model does not aim, or expect, to produce 100% accurate seat level predictions for each of the 650 constituencies (and indeed cannot do so for the 18 constituencies in Northern Ireland). These analyses simply estimate what party seat levels would be, should such national support trends be replicated in an actual general election. For a variety of reasons (including the impact of high levels of undecided voters in a specific poll), the actual result of an election contest may vary from the figures suggested by an opinion poll, even if the poll is carried out relatively close to election day, or on election day itself as in the case of exit polls, but the likelihood of such variation is not something that can be factored into this model.
