
Adrian Kavanagh, 22nd June 2015
As noted in last month’s post, the national voter turnout rate of 60.5% – which was just 9.4% lower than the turnout level for the 2011 General Election – for the Marriage Equality (and Presidential Candidate Age) referendum contests compared very favourably with the turnout levels for other referendum elections, especially given that these were “stand-alone” contests, which did not take place on the same day as a general, local, European or Dail by-election contest (with the notable exception of Carlow-Kilkenny).
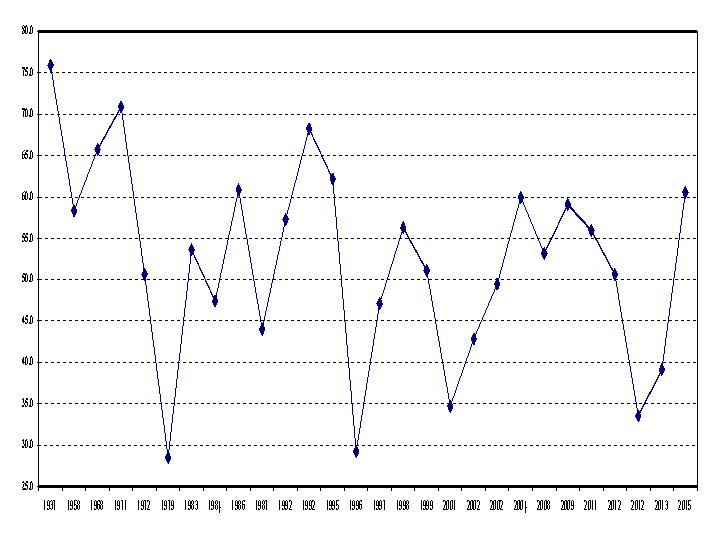
Figure 1: Turnout levels at Irish referendum elections, 1937-2015
As with previous referendum election contests, turnout levels for these contests tended to be higher in the more urban constituencies (62.4%, on average) and especially in Dublin (63.9%).
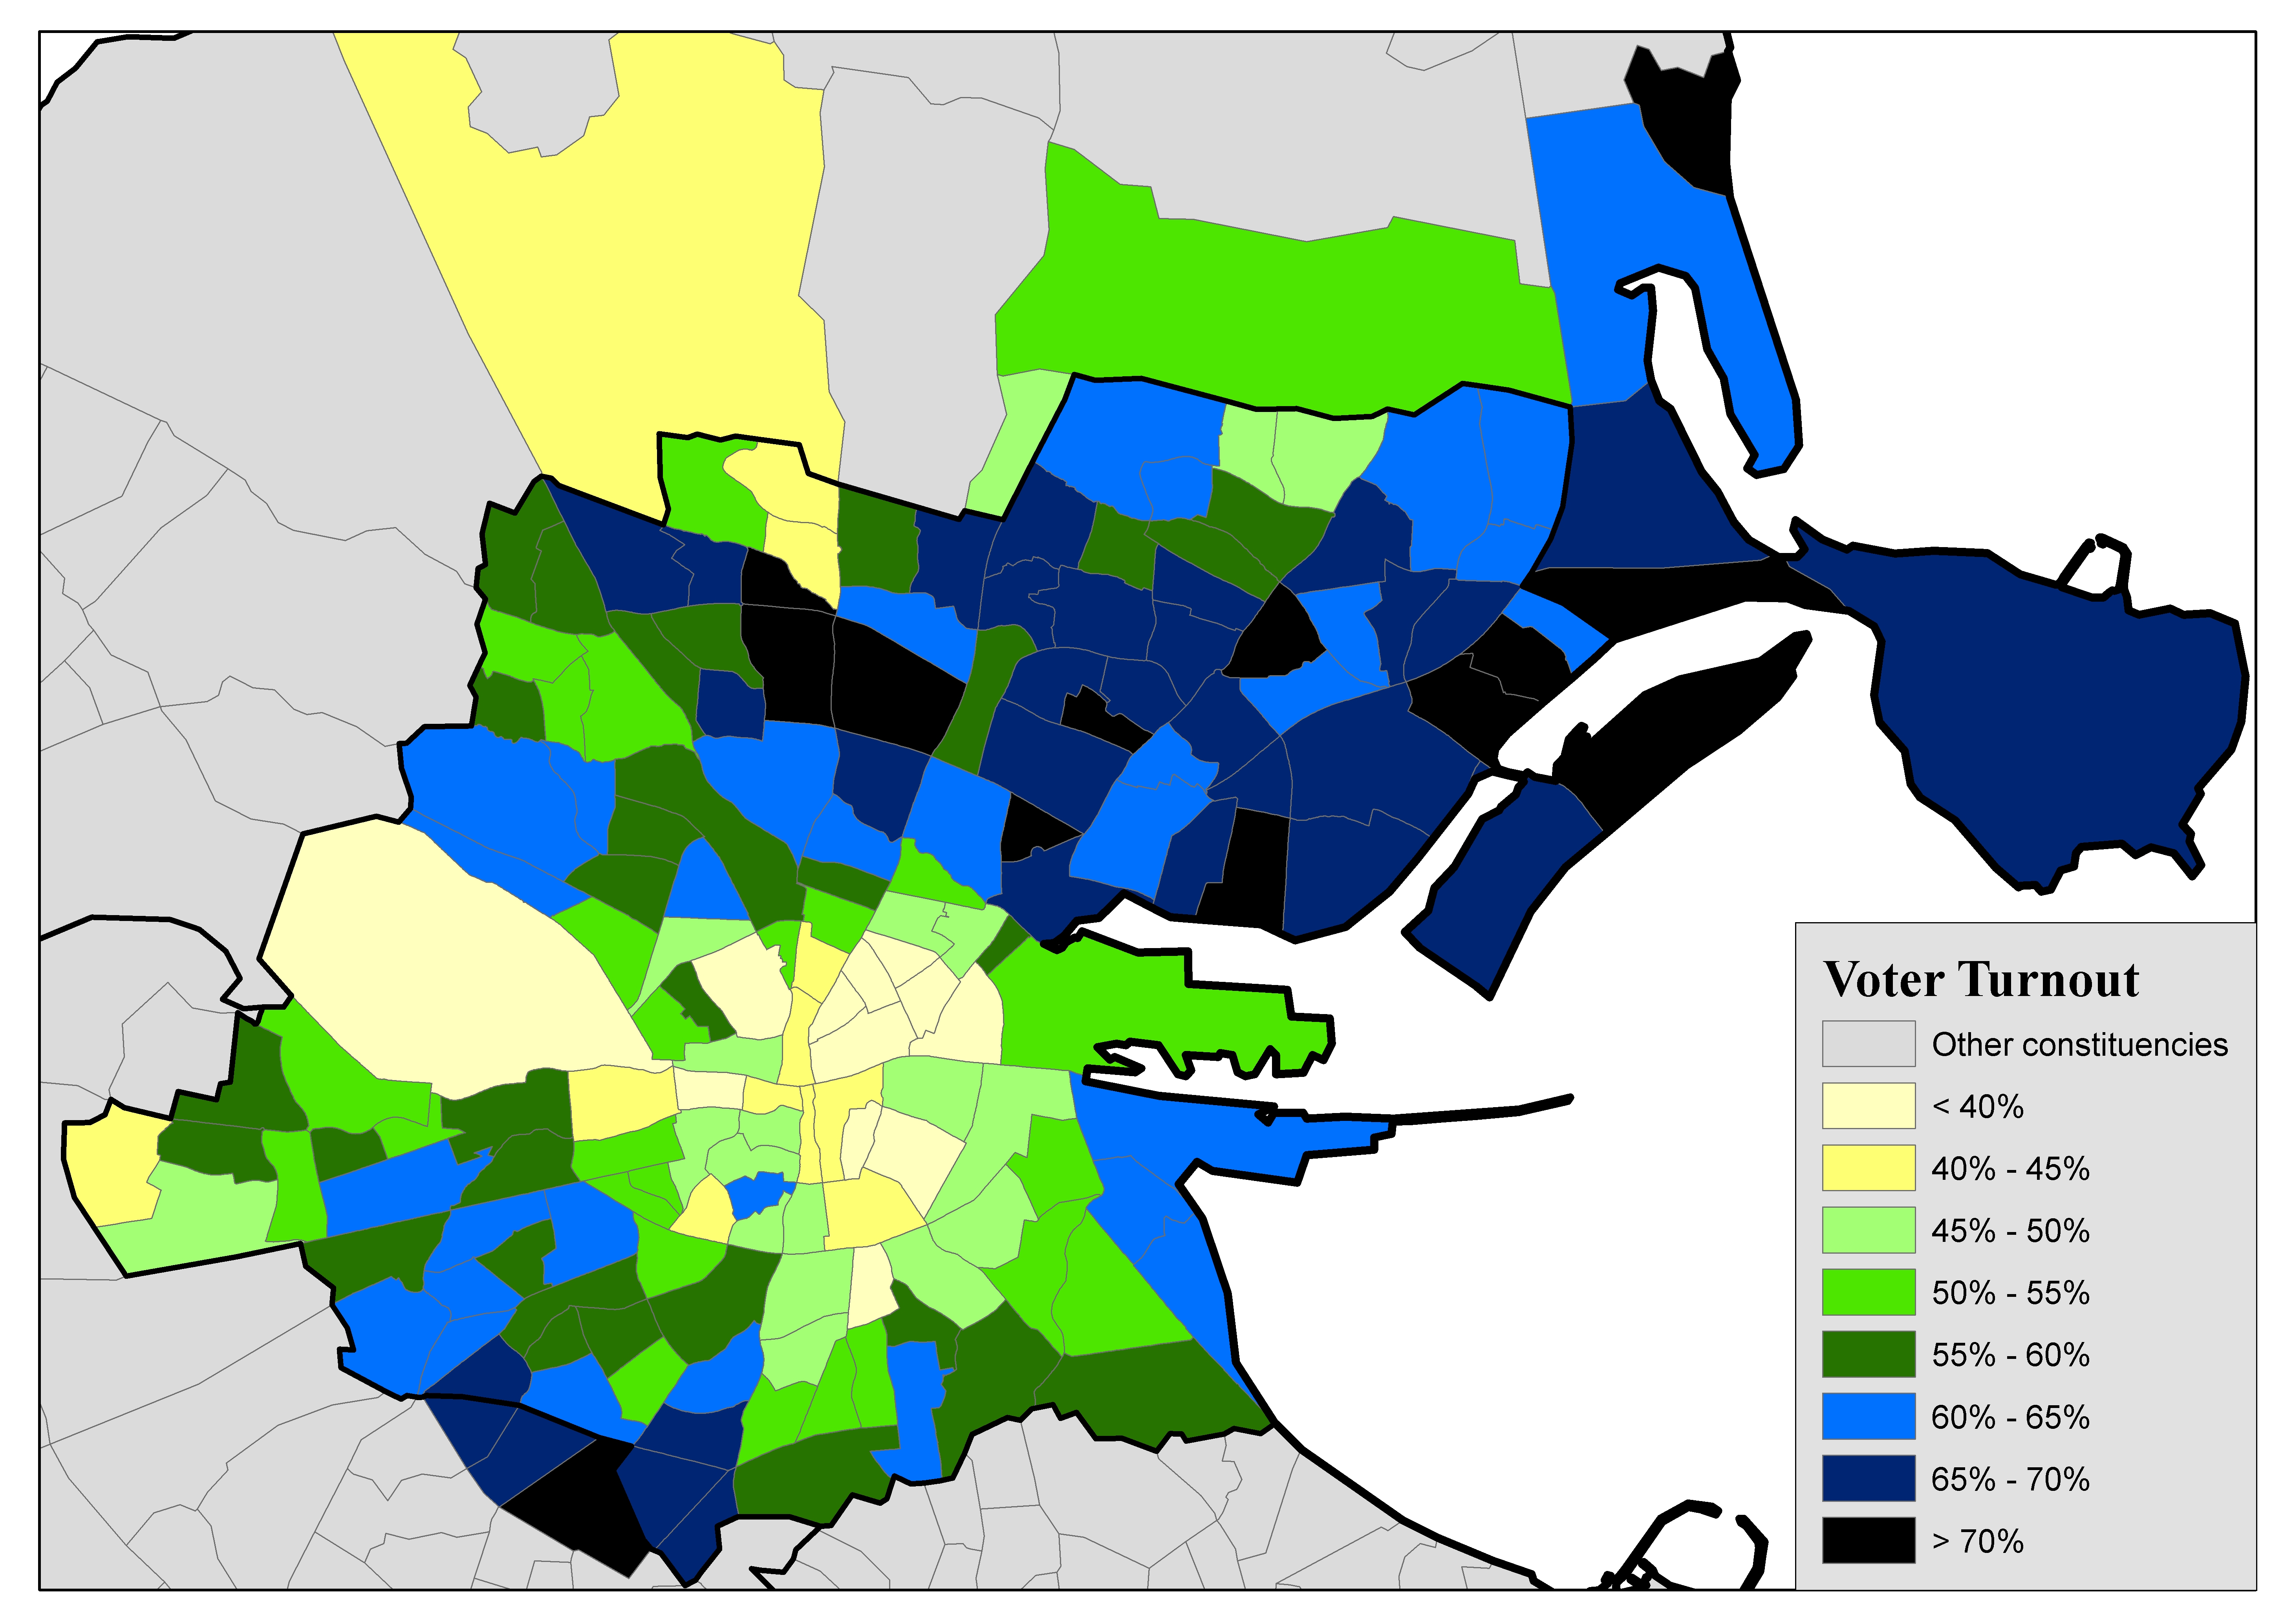
Figure 2: Voter turnout (%) levels by electoral division in the Dublin City constituencies for the 2015 Marriage Equality Referendum
Based on the excellent turnout by polling box data provided on the Dublin City Returning Officer’s website, it was possible to analyse these and calculate turnout estimates for each of the electoral divisions located within the six Dublin City constituencies. In mapping these (Figure 2), significant differences in turnout levels across the Dublin City constituencies area can be illustrated. (This area includes not just those electoral divisions located within Dublin City, but also electoral divisions (such as Howth, Tempelogue-Kimmage Manor and Portmarnock North) located in the neighbouring counties of Fingal or South Dublin, which fell within the constituency boundaries of Dail constituencies that were administered by the Dublin City Returning Officer.)
The overall turnout level across the Dublin City constituencies area for these two referendum contests was 61.8%, which compared very well with the average turnout level of 40.5% for this same area for the 2013 Seanad and Court of Appeal referendum contests. Thus, on average, the percentage turnout level in this area increased by just over twenty percent between the referendum contests of 2013 and 2015.
As Figure 2 shows, the highest turnout levels in this area tended to be associated with the more middle class and settled parts of this area. This included parts of Clontarf, which was not surprising given that the highest turnout level by constituency at these contests was found in Dublin North-Central (68.9%). Other high turnout areas, highlighted by this map, included Howth, Portmarnock, Raheny, Drumcondra and Glasnevin, as well as Templeogue and Terenure. The most significant cluster of low turnout was associated with the Dublin Inner City (with low turnout levels also being associated with the Phoenix Park area), while lower than (the City) average turnout levels were associated with some of the more working class areas, such as Cherry Orchard and Ballymun.
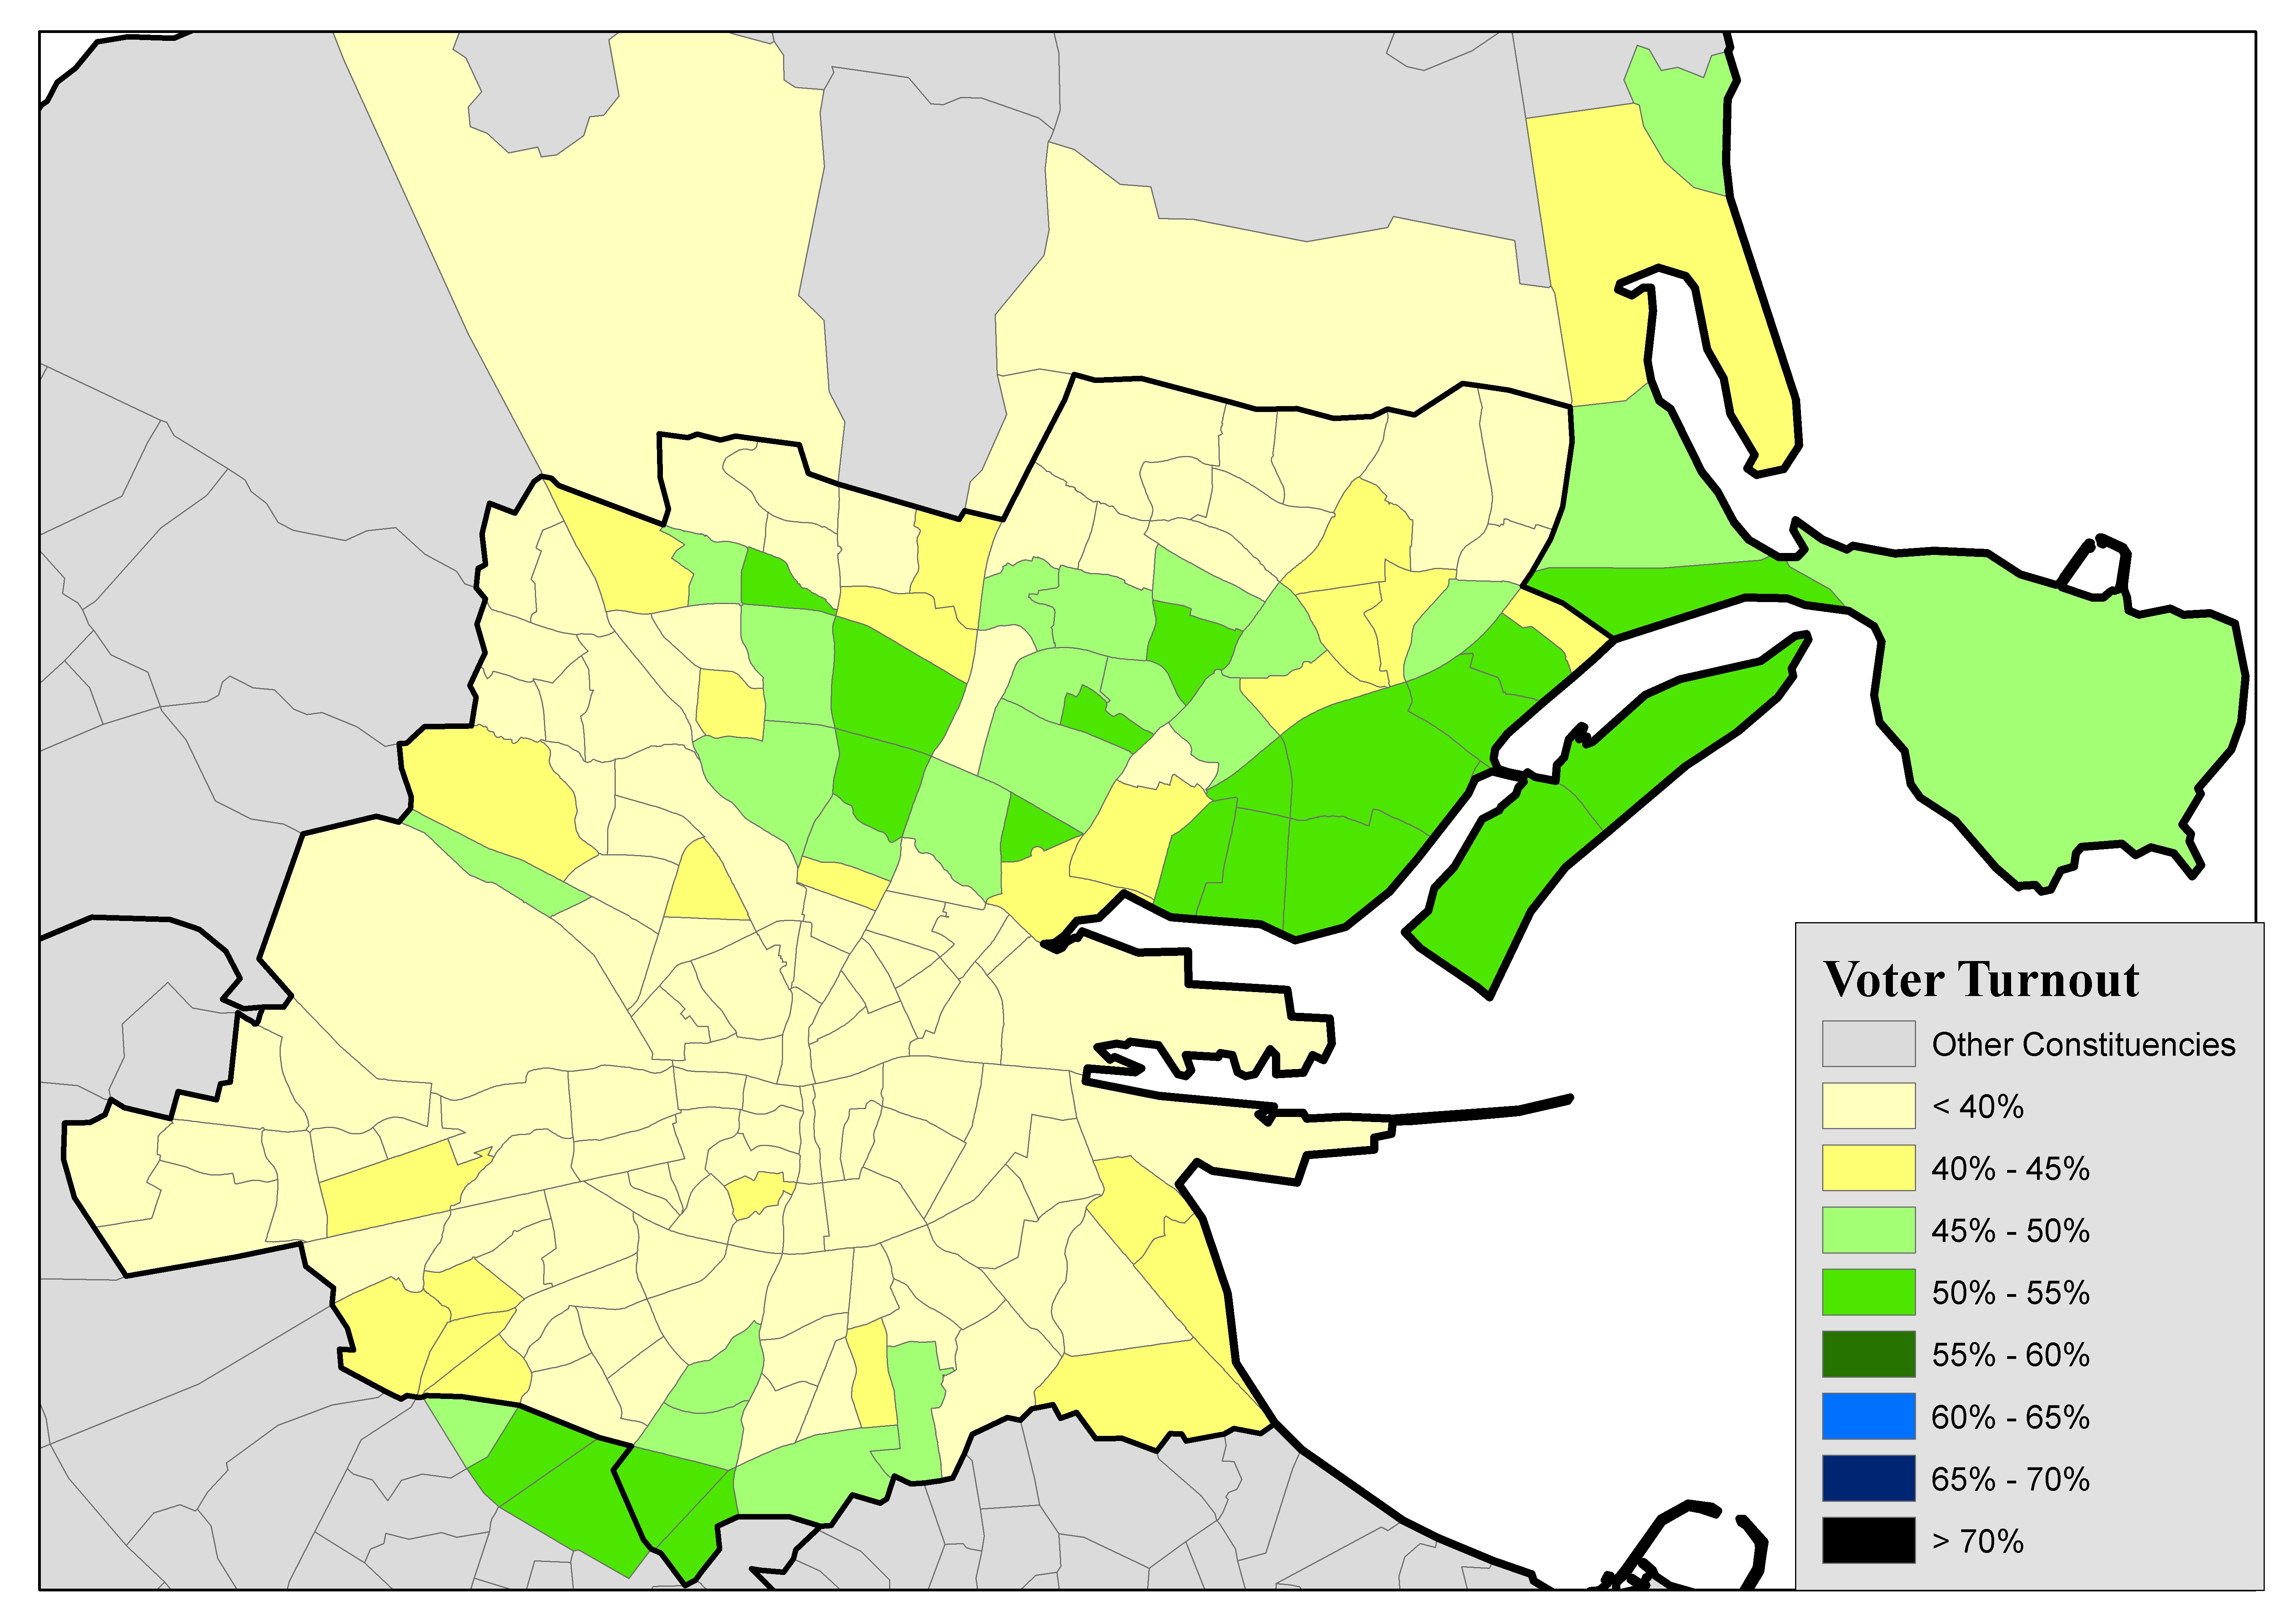
Figure 3: Voter turnout (%) levels by electoral division in the Dublin City constituencies for the 2013 Seanad Referendum
Given the relatively high turnout levels (for referenda) associated with these contests, it is perhaps not suprising that turnout levels in the May 2015 elections compared very favourably with the last referendum contest, the 2013 Seanad Referendum, as suggested by the turnout map for this election (Figure 3).
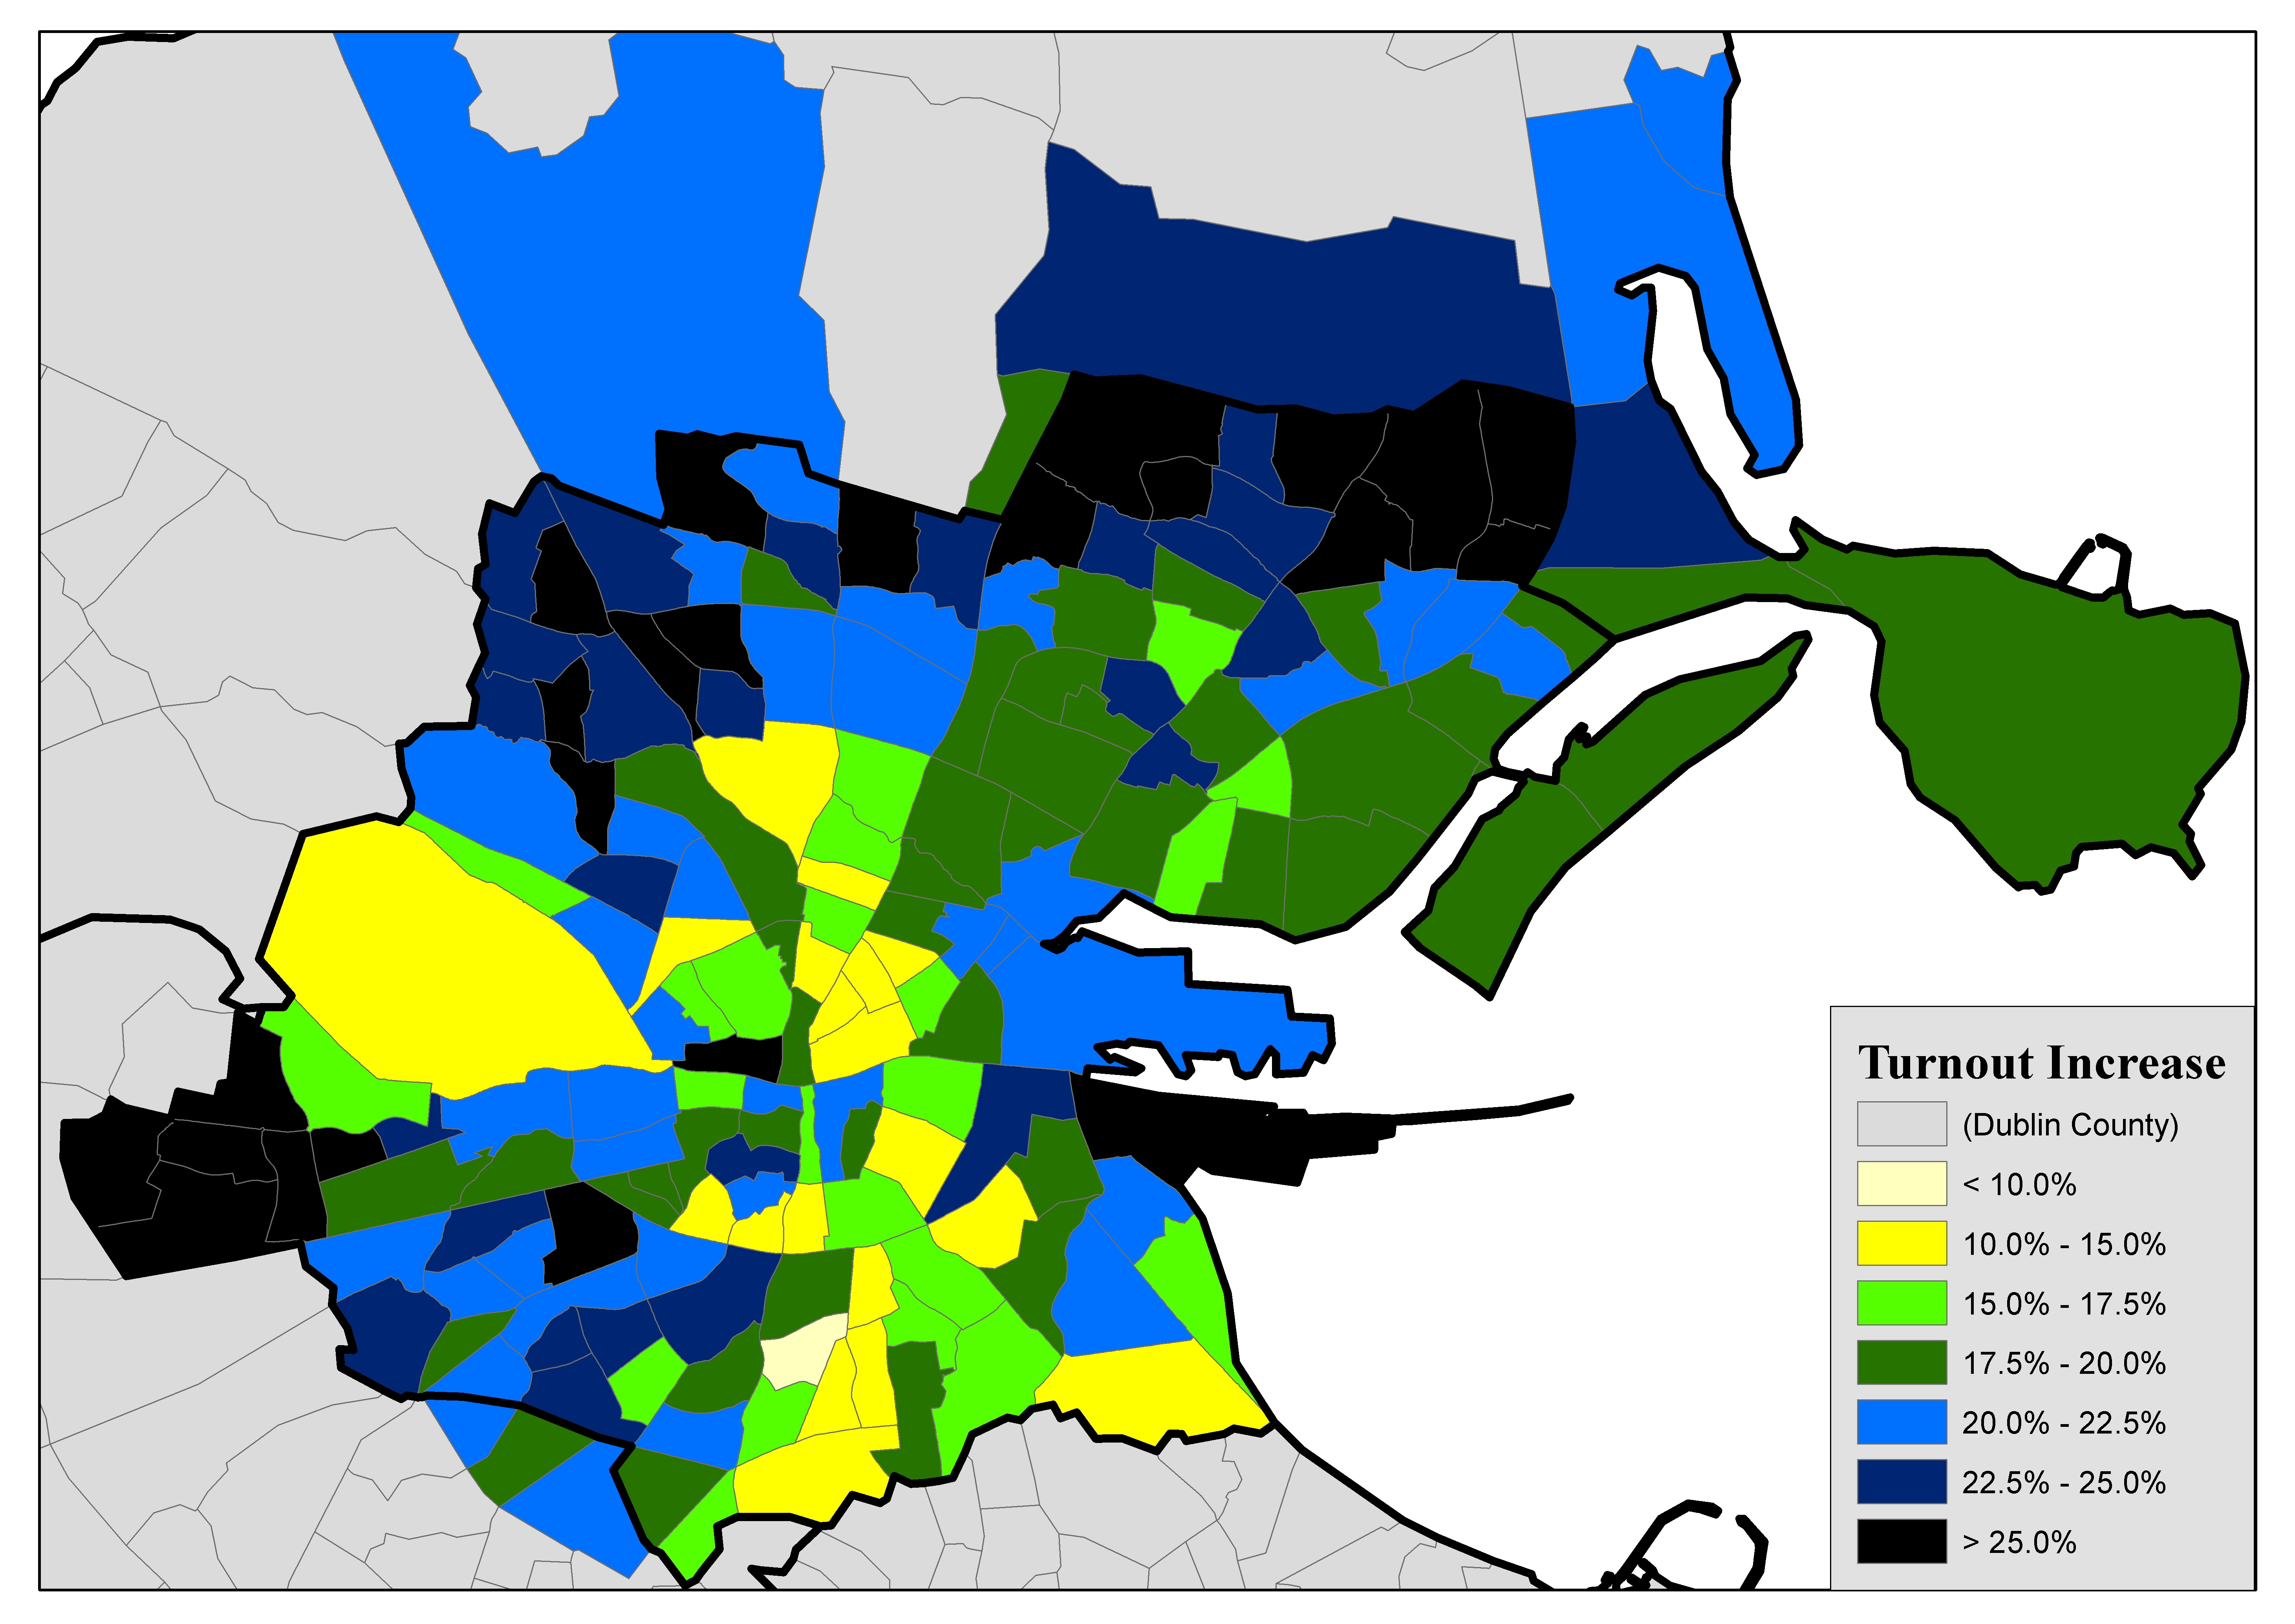
Figure 4: Differences in voter turnout (%) levels by electoral division in the Dublin City constituencies between the 2015 Marriage Equality and 2013 Seanad referendum contests
Indeed, as Figure 4 shows, turnout levels improved notably across all of the Dublin City constituencies area between the 2013 Seanad and 2015 Marriage Equality/Presidential Candidate Age referendum contests. Turnout levels were at least ten percent higher in most of this area. But the extent of the turnout increase was even more notable in most of the more working class parts of the Dublin City constituencies area. In areas such as Cherry Orchard, Ballyfermot, Finglas, Ballymun, Darndale, Crumlin and Ringsend, turnouts were over twenty percent higher (and over twenty five percent higher) than the levels recorded in these areas for the 2013 Seanad Referendum, as illustrated by Figure 4.
If the increases in percentage turnout levels between the 2013 Seanad and 2015 Marriage Equality referendum contests for the Dublin City constituencies area was dramatic, the increase in actual voter numbers was even more striking. The number of votes cast in this area increased from a level of 143,046 for the 2013 Seanad Referendum to a level of 223,401 for the 2015 Marriage Equality Referendum (representing a 56.2% increase in the number of votes cast between these referendum contests). Thus, just over one hundred thousand more people opted to vote in the 2015 referendum contests in the Dublin City constituencies area relative to the numbers in this area who voted in the 2013 referendum contests.
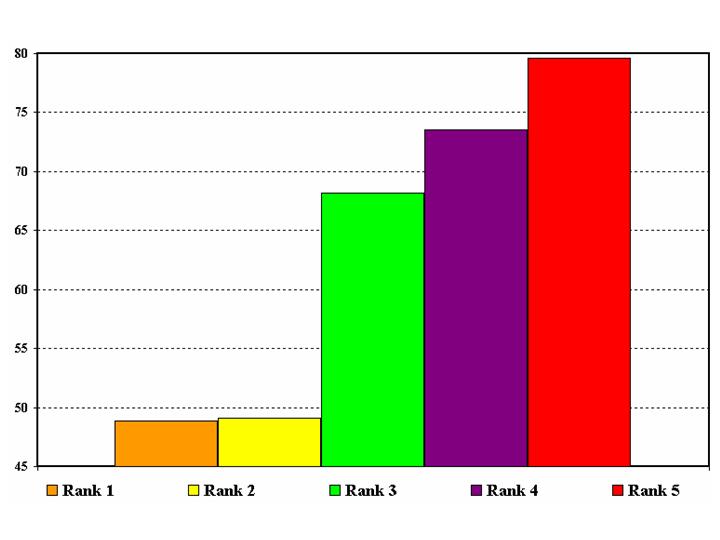
Figure 5: Percentage increase in voter turnout by social class area in Dublin City between the 2013 and 2015 referendum contests
As Figure 5 strikingly illustrates, the biggest increase in voter numbers in the Dublin City constituencies area tended to be associated with the more working class areas. The increase in the number of voters between 2013 and 2015 was less than 50% in the Rank 1 areas (the 20% most affluent areas/electoral divisions within the City), as was also the case for the Rank 2 areas (the next 20% most affluent areas/electoral divisions within the City). As Figure 2 shows, as affluence levels declined the percentage increase in the number of voters became even larger. Indeed, the most notable increase in voter numbers was associated with the Rank 5 areas (the 20% least affluent areas/electoral divisions within the City), with an average increase of close to eighty percent in overall voter numbers being recorded across these areas, as Figure 5 shows.

Pingback: Geography and Elections – Studying voter turnout levels at the 2015 Marriage Equality Referendum | Eye on the World