A Geography of Voter Turnout at the 2016 General Election: A Focus on Dublin City

Adrian Kavanagh, 15th April 2016

Voter turnout can be defined as the percentage of people who turn out to vote in a given election. In the USA, voter turnout levels are calculated the percentage of the valid adult population (aged 18 and over) who turn out to vote. In Ireland and other European countries, however, voter turnout levels are expressed as a percentage of the number of people on the electoral register. Thus, if there are problems with the electoral register, turnouts may be over, or under, estimated in these countries, including Ireland. Rather than skewing/determining the geography of voter turnout levels in Ireland, however, register inaccuracies have the effect of actually dampening the extent of turnout differences. Research based on the 2002 General Election and 2002 Census showed that registration levels in high turnout areas – mainly rural areas, but also including some settled middle class urban areas – tended to be over-estimated, meaning that the “real turnout” levels in these higher turnout areas (or the turnout level as related to the valid adult population) was actually higher than the recorded ones.  By contrast, registration levels in very low turnout areas – mainly inner city areas and commuter belt areas – tended to be under-estimated, meaning that the “real turnout” levels in these low turnout areas were actually even lower than the recorded levels.

Despite often being viewed as a country with a high level of interest in all things political, Ireland has had one of the lowest average turnout levels in Western Europe. For instance, only Portugal and Switzerland had lower average turnouts than Ireland did during the 1990s. At the same time, turnout rates were declining in western democracies in the last few decades of the 20th Century, with some particularly significant drops evidenced between electoral contests; for instance the UK general election turnout level fell from 71.5% in 1997 to 59.4% in 2001. Low and declining voter turnout levels also became increasingly characteristic of Irish electoral contests from the early 1980s onwards, with general election turnouts falling by 13.5% between 1981 and 2002. Turnout levels fluctuated significantly during the Celtic Tiger period, and especially in those areas that had been impacted on the most by the social and economic changes of the late 1990s and 2000s, associated with the Celtic Tiger, namely the more urban parts of the state and most notably in Dublin and its commuter belt. At the national level, turnout trends in the earlier part of this period marked a continuation of a sustained decline in electoral participation levels that had marked all Irish electoral contests since the early 1980s. The low turnout levels for the 2002 contest marked the culmination of this trend, as subsequent electoral contests, starting with the second Nice Treaty Referendum in 2002, would see a recovery in turnout levels across different electoral contests, with these generally returning to levels experienced before the start of the Celtic Tiger era, with the exception of some notable low turnout contests.

Trends in relation to fluctuating voter turnout patterns were most pronounced in urban Ireland, with turnout levels falling by almost ten percent in Dublin and its commuter belt between 1992 and 2002 but then rebounding back almost to the 1992 levels for the 2007 contest and then proceeding to exceed the 1992 levels at the 2011 General Election. Ultimately, with the level of turnout improvement not being as marked in the generally higher turnout rural areas, this resulted in a significant narrowing of the very significant turnout differences between rural and urban Ireland that had characterised the low turnout elections of 1999 (local and European elections) and 2002 (general election). But the low turnout 1999 and 2002 elections were also characterised by dramatic turnout differences within the low turnout urban areas, with very notable class-based turnouts being observed in a number of working class areas in Dublin, including Ballyfermot/Cherry Orchard, North Clondalkin, West Tallaght, Ballymun and Darndale, during this period, in addition to the Dublin Inner City area. The 2000s, however, marked an improvement in turnout levels in a number of these working class areas – with the notable exception of the inner city – and resulted in a narrowing of the class-based turnout differences within Dublin, with the narrowing of these turnout differences being particularly accelerated during the period of the Economic Crisis, from 2008 onwards.

Figure 1: Voter turnout level (%) at the 2016 General Election by Dail constituency.

Figure 1: Voter turnout level (%) at the 2016 General Election by Dail constituency.

Turnout trends at the 2016 General Election proved to be rather disappointing, in that the trend of improving turnout levels, observed across much of the 2000s, was halted. Turnout levels, nationally, fell by almost five percent. Well over one million registered voters did not turn out to vote at this election – a number that was roughly twice as large as the number supporting the largest political party at this election, Fine Gael (Figure 2).
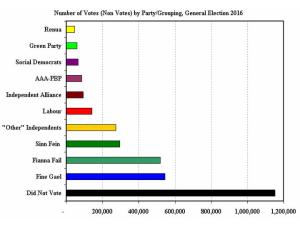
Figure 2: Non-voter numbers at 2016 General Election as compared with numbers of voters supporting different political parties/political groupings

Figure 2: Non-voter numbers at 2016 General Election as compared with numbers of voters supporting different political parties/political groupings

Turnout levels were higher in rural Ireland, although the large rural-urban variations in turnout levels that were associated with the 2002 contest were not as apparent with the 2011 and 2016 elections. That being said, there was a notable drop in the average turnout level in Dublin from a level of 68.2% at the 2011 election to a level of 62.8% at the the 2016 contest. There was also a notable drop in turnout levels in parts of rural Ireland, however, and the very high turnouts associated with constituencies such as Roscommon-South Leitrim (78.7%) and Tipperary North (77.2%) in 2011 were not as readily apparent in the 2016 election. The highest turnout constituencies again tended to be found in rural Ireland, but only four constituencies recorded turnout levels above the seventy percent level – namely Roscommon-Galway (71.6%), Wicklow (70.9%), Kerry (70.9%) and Wicklow (70.0%). By contrast, the lowest turnout levels were again associated with the three Dublin constituencies that take in parts of the Dublin Inner City – namely Dublin Central (52.4%), Dublin Bay South (54.8%) and Dublin South-Central (58.1%).
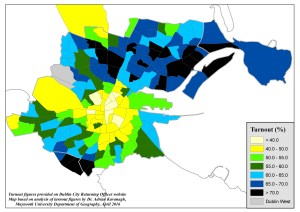
Figure 3: Voter turnout levels (%) by election division in the Dublin City constituencies at the 2016 General Election

Figure 3: Voter turnout levels (%) by election division in the Dublin City constituencies at the 2016 General Election

Polling station-level turnout data (ballot reconciliation figures) released on the Dublin City Returning Officer’s website over the past few days means that an electoral division level analysis for this election is possible for the five Dublin City constituencies. Mapping these figures (Figure 3) shows that there still remains very definite geographical pattern to the Dublin City turnout levels – almost akin to a doughnut effect with low turnout in the centre of the city and higher turnout on the edges of the Dublin City Council area– a pattern that has been largely similar for all other electoral contests held during the 2000s. The higher turnout levels tend to be found in the more settled and more middle class parts of the city’s northern and southern inner suburban zones, encompassing places such as Templeogue in the south and Clontarf, Raheny and Glasnevin in the north. The main concentration of lower turnout is very much focused on the Dublin Inner City, with most electoral divisions in this area registering turnout levels lower than the 50% level, with the notable exception of the Tenters area (Merchants Quay D electoral division) in the South West Inner City. At the polling station level, the ballot reconciliation turnout figures released by the Dublin City Returning Officer showed that the polling box returning the highest turnout level in the City was Box 3 in the Raheny Public Library (Howth Road) polling station, with a very high 81.0% turnout level. This area covered by this box was located within the Raheny-St. Assam electoral division. The polling box returning the lowest turnout level in the City was Box 6 in the St. Paul’s CBS, North Brunswick Street polling station, with a very low 22.1% turnout level. The area covered by this box is located in the North City electoral division. Indeed, North City was one of the two electoral divisions to have a turnout level of lower than thirty percent at this election, based on the ballot reconciliation data analysis, with the other one being the neighbouring Rotunda B electoral division.

The more working class parts of the city, dominated by Dublin City Council housing estates, also tended to have lower than average turnout levels for this contest. But the gap in turnout levels between these areas and the more middle class areas in the city has narrowed considerably over the past decade and a half. Turnout levels in some traditional working class areas were indeed close to, or even higher than, the average turnout level across the five Dublin City constituencies (59.7%); most notably in the case of the West Cabra area.  While the data is not available, at present, to study the rest of the Dublin region, the general trend in other parts of Dublin (Fingal, South Dublin County and Dun Laoghaire-Rathdown) in previous elections – most notably the 2014 Local and European elections – has pointed to a similar narrowing of class-based turnout differences in the rest of Dublin, with improving turnouts levels being evident in working class areas, such as North Clondalkin, across the 2000s.

The general trends in recent years suggest that, as class becomes a less significant factor in terms of shaping/explaining turnout variations across the city, residential mobility is emerging as a particularly significant factor in terms of pointing towards/resulting in areas of lower voter turnout levels. This can be evidenced in the trends observed in Figure 3 (above), as well as in other previous voter turnout studies on this site, which observe low turnout levels in the Dublin Inner City, but also other new residential areas such as parts of the Greater Blanchardstown and South Lucan areas as well as the Northern Fringe. Analysis that I carried out in relation to the 1999 and 2002 elections in the South West Inner City showed that the main low turnout areas there were not, as might have been expected, the Dublin City Council flat complexes and housing estates. Instead, the very low turnout levels were associated mainly with the (then) new private gated apartments in that area.

That being said, many of the areas with higher levels of residential mobility also tend to have higher levels of non-Irish/UK citizen residents – especially the Dublin Inner City. While non Irish/UK citizen residents may have been on the electoral register for these areas, they would not have been eligible to vote in the general election – have the right to only vote in local elections, or local and European elections. Therefore, a high number of non-Irish/UK citizen residents on the register would have pushed down the turnout figures here by default. If I have the time (and money!) to purchase and analyse the marked registers of electors for these constituencies, I will follow up on this to uncover what general election turnout levels in these areas would be if non Irish/UK citizen residents were not included in the analysis. (Similar analysis in the past shows that the turnout levels in these area tend to be higher by a few percentage points, but turnout levels still remain low relative to other areas in the City – and, of course, the state.) Such analysis is not possible when only using the ballot reconciliation figures.

To conclude, as noted in the earlier post discussing voter turnout in the 2011 General Election, it must be noted that voter turnout levels are the result of a multiplicity of different turnout decisions made by individual electors, with these in turn being shaped by a host of a number of, often conflicting, factors, and also by the places in which they live and work. A range of socio-economic, demographic, political and institutional factors help explain why turnouts between areas differ, with some of these listed below. Perhaps the most significant factor of all in terms of predicting turnout variation is housing tenure, as this is a factor that relates to nearly all of the other key influences on turnout variation.

Factors that tend to be associated with/result in higher turnout areas/levels include:

  • Older populations
  • Married people
  • Residential stability
  • Rurally based/Agricultural employment
  • Affluence/high levels of social well-being
  • High levels of education
  • Owner occupied housing
  • High levels of political mobilisation
  • Proximity to the polling station
  • High levels of political choice
  • Weekend voting
  • Numbers on electoral register are under-estimated*

Factors that tend to be associated with/result in lower turnout areas/levels include:

  • Younger populations
  • Single or Separated people
  • Population mobility
  • Urban-based employment
  • Social deprivation
  • Low education standards
  • Local authority or private rented housing
  • Low levels of political mobilisation
  • Distance from the polling station
  • Low levels of political choice
  • Voting on weekdays
  • Numbers on electoral register are over-estimated*

*  While the under-estimating (over-estimating) of numbers on the electoral register will result in the recorded turnout levels being higher (lower) than they are in reality, past research has actually shown (as discussed above) that registration levels generally tend to be under-estimated in lower turnout areas (meaning that turnouts in those areas are actually lower than their recorded levels) and registration levels generally tend to be over-estimated in higher turnout areas (meaning that turnouts in those areas are actually higher than their recorded levels).

Posted in Electoral Geography (voting maps), General Election, Voter turnout | Tagged , , , , , , | 1 Comment

As you were more or less…: Constituency-level analysis of the Sunday Business Post-Red C opinion poll (13th March 2016)

Adrian Kavanagh, 12th March 2016

The counting for the February 2016 General Election has concluded and new Dail has just sat for the first time (on Thursday), but we already have our first post-general election opinion poll. Yesterday’s Sunday Business Post-Red C opinion poll estimates party support levels as follows: Independents and Others 29% – including Social Democrats 5%, Anti-Austerity Alliance-People Before Profit 4%, Renua 2%, Green Party 3%, Independent Alliance 5%, Other Independents 9%, Fine Gael 27%, Fianna Fail 25%, Sinn Fein 15%, Labour Party 4%. As such, there is no major movement in party/grouping  support levels since the February 26th election, with the notable exceptions of the Social Democrats (up 2%) and Labour (down 3%). My constituency-level analysis of these poll figures estimates that party seat levels, should such national support trends be replicated in an actual general election, would be as follows: Fianna Fail 47, Fine Gael 53, Sinn Fein 25, Labour Party 0, Anti Austerity Alliance-People Before Profit 5, Social Democrats 4, Green Party 2, Independents 22. 

(Update: Following the prolonged period of government formation, there was a gap of exactly two months until the next Red C opinion poll was published. This did not point to any significant movement in the numbers, with no change in the Fine Gael and Fianna Fail support levels, but this poll did show the Independents losing some ground to Sinn Fein and some of the smaller parties/groupings. The May 13th Paddy Power-Red C opinion poll estimates party support levels as follows: Independents and Others 29% – including Social Democrats 4%, Anti-Austerity Alliance-People Before Profit 6%, Renua 1%, Green Party 4%, Independent Alliance 3%, Other Independents 9%, Fine Gael 27%, Fianna Fail 25%, Sinn Fein 16%, Labour Party 5%. My constituency-level analysis of these poll figures estimates that party seat levels, should such national support trends be replicated in an actual general election, would be as follows: Fianna Fail 48, Fine Gael 52, Sinn Fein 25, Labour Party 2, Anti Austerity Alliance-People Before Profit 8, Social Democrats 4, Green Party 2, Independents 18. Note that the remainder of the discussion/analysis in this post relates solely to the March 13th opinion poll.)

Continue reading

Posted in opinion polls | Tagged | 1 Comment

Seanad Elections April 2016: Votes Controlled By Parties/Groupings

Adrian Kavanagh, 8th March 2015

Figure 1: Seanad 2016 Vocational Panels - Votes controlled by different political parties/groupings

Figure 1: Seanad 2016 Vocational Panels – Votes controlled by different political parties/groupings

Elections to the five different Seanad vocational panels (as well as for the Trinity and National University of Ireland constituencies) for the 25th Seanad will take place over the coming months. While there are obvious restrictions in terms of the electorates for the Trinity and NUI constituencies, the electorates for the five vocational are solely comprised of elected politicians, namely

  • 949 City and County Councillors (councillors elected in 2014, or co-options between 2014 and 2016)
  • 158 Dail Deputies (those elected in February’s general election)
  • 53 Senators (elected at the 2011 Seanad election, or elected at Seanad by-elections between 2011 and 2015 – excluding the 7 Senators who won seats in February’s general election)

Assuming that co-options are in place to replace the 49 City and County Councillors who won seats at the February General Election (as well as Cllr. Willie Kennedy – ar dheis Dé go raibh a anam and Cllr. Dan Joe Fitzgerald – ar dheis Dé go raibh a anam), this means that the total size of the electorate for the Seanad vocational panel elections will be 1,160. If one was to assume that every one out of these 1,160 TDs, Senators and Councillors vote in these elections, this figure would translate into quotas of around: Continue reading

Posted in Seanad election | Tagged | 5 Comments

Final Seat levels at February 2016 General Election – An Overview

Adrian Kavanagh, 3rd March 2016

With the Longford-Westmeath “long count” about to conclude this morning with the election of Fine Gael’s Peter Burke and Labour’s Willie Penrose, the final overall seat tallies can be confirmed as follows:

  • Fine Gael 50
  • Fianna Fail 44
  • Sinn Fein 23
  • Independents 23 (including Independent Alliance 6 and Independents4Change 4)
  • Labour Party 7
  • Anti Austerity Alliance-People Before Profit 6
  • Social Democrats 3
  • Green Party 2

Underneath these figures lie some interesting regional/geographical variations in terms of where parties/groups won seats and where they made gains/losses relative to 2011. Continue reading

Posted in Uncategorized | Leave a comment

How did the Younger Ones (candidates aged between 21 and 35) fare at General Election 2016

Adrian Kavanagh, 1st March 2016

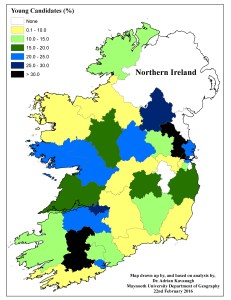
Figure 1: Percentage of younger candidates (aged between 21-35) by Dail constituency (2016 General Election)

Figure 1: Percentage of younger candidates (aged between 21-35) by Dail constituency (2016 General Election)

In an earlier post, I listed all eighty four candidates in the 21-35 age category (15.2% of the total number of General Election candidates) who contested Friday’s general election contest. This post reviews how these candidates fared in the election and finds that only 13 (15.1% of the younger candidates’ grouping) went on to win seats in the election. This contrasts starkly with the trends observed at the 2011, as discussed in an earlier post. In this election, twice as many younger candidates proved to be ultimately successful – 27 younger candidates, amounting to 39.7% of the younger candidates contesting that election. There is no sense that the expected boost in youth turnouts, following on the strong mobilisation of younger voters at the 2015 Marriage Equality Referendum, acted to improve the electoral prospects of younger candidates in the February 2016 election. Continue reading

Posted in Candidates, General Election, Young candidates | Tagged , , | Leave a comment

Tally Ho! Which local newspapers have published General Election 2016 tally figures?

Adrian Kavanagh, 1st March 2016

As an electoral geographer, I am very interested in outlining which local newspapers published tally figures for February’s general election contest. When I refer to tallies/tally sheets I am of course NOT referring to election results or election count details, but instead referring to documents that can show the number of votes each candidate won in each polling box in a Dail/general election constituency – or part of a general election constituency. These can give a very accurate sense then as to the geography of a party/candidates’s votes within a particular constituency. Tally figures are the very lifeblood of Irish electoral geography. Continue reading

Posted in General Election, Tally figures | Tagged , , , , | 5 Comments

Female candidates at the 2016 General Election

Adrian Kavanagh, 29th February 2016.

Figure 1: Percentage support for female candidates by Dail constituency, 2016 General Election

Figure 1: Percentage support for female candidates by Dail constituency, 2016 General Election

As of this morning, counting is still continuing in a number of constituencies, but at this stage it is clear that there will be a significant increase in the number of seats won by female candidates relative to the level won in 2011, while there will also be a notable increase in the number of votes won by female candidates. At the 2011 General Election, female candidates won just 25 of the 166 Dail seats (or of the 165 Dail seats being contested). Female candidates won 332,821 first preference votes nationally, amounting to 14.8% of the national first preference votes. The low female vote levels/seat levels were, in part, due to the small number of female candidates contesting that election, with only 86 female candidates (out of a total of 566) contesting this election – 15.2% of the total.

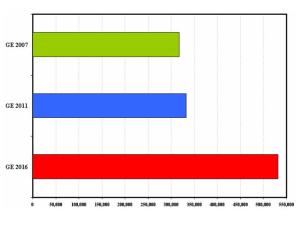
As has been well flagged already, and as discussed in detail in the 2016 General Election Candidates post, the introduction of a gender quota resulted in a significant increase in female candidate levels, with 163 female candidates contesting the election (out of a total number of 551, amounting to 29.6% of the total number of candidates).  Did this also result in an overall increase in support levels and seat levels for female candidates? Why, yes. At this stage, it looks as if 35 female candidates will win seats in this election – amounting to 22.3% of the 157 seats being actually contested over the weekend, or 22.2% of the 158 seats in the next Dail. The overall support level for female candidates also increased notably. At this stage (and this number is likely to be amended slightly following some final recounts), it can be be stated that female candidates won over half a million votes (531,800 votes) for the first time in a Irish general election – amounting to 24.9% (almost one quarter) of the first preference votes cast in this election. This amounts to an increase of almost 200,000 in the total number of first preference votes won by female candidates between the 2011 and 2016 General Elections (see Figure 2 below).

Figure 1: First preference votes won by female candidates at the 2007, 2011 and 2016 General Elections

Figure 2: First preference votes won by female candidates at the 2007, 2011 and 2016 General Elections

Female candidates fared best in the Dublin region, where they won 38.8% of all the first preference votes and 18 of the 44 seats (40.9%). Outside of Dublin, female candidates accounted for 20.4% of all the first preference votes. The notable urban-rural divide, or East-West divide, in female success levels is further underpinned by the fact that the next strongest region for female candidates was Leinster (25.3%), followed by Connacht-Ulster (23.6%) and Munster (15.2%).

As Figure 1 (above) shows, female candidates fared especially well in some constituencies, but particularly in the Dublin region. Female candidates had accounted for over half of the candidates (5 out of 9) in the Kildare South constituency. But in this election, female candidates won over half of the first preference votes in two Dublin constituencies – Dublin South-Central (59.4%) and Dun Laoghaire (57.9%). They came very close to winning half of the votes in the Dublin Central (49.3%) constituency. Outside of Dublin, the best constituency for female candidates in terms of first preference votes was Cavan-Monaghan (44.6%).


Posted in Gender, General Election | Tagged , | Leave a comment

RTE-Behaviour & Attitudes exit poll (27th February) – quick overview

Adrian Kavanagh, 26th February 2016

The RTE-Behaviour & Attitudes exit poll was published within the last few minutes

Figures are similar to last night’s exit poll, but slightly worse for the government parties. These figures suggest that support levels for both government parties have fallen by over ten percent relative to their 2011 figures. Both Fianna Fail and Sinn Fein make gains, although the extent of Sinn Fein gains may be relatively disappointing for that party given the support it enjoyed in most opinion polls across 2014 and 2015 and indeed up to the final week of the February 2016 General Election campaign. This party fare better in this exit poll however.

The extent of Fine Gael losses may actually help Labour to hold more of its seat than might have been expected in recent analyses, indeed over and above the seat estimates outlined below, as Labour candidate may now be able to benefit from Fine Gael eliminations/transfers in a number of constituencies.

Fianna Fail are likely to be competitive in most constituencies. If the swing to the party is mirrored, or even stronger, in Dublin, they may well be in contention in some constituencies that seemed to be long shots for most of the campaign, including Dublin Central. But the swing to the party may also result in massive surpluses in constituencies where the party ran just one candidate, such as Laois, Limerick or Limerick City.

My initial run of the model estimates seat levels by party/grouping, based on a constituency level analysis of the exit poll as follows:

Fine Gael 47, Independents and Others 42, Fianna Fail 37, Sinn Fein 24, Labour Party 8

  • Labour, however, on these numbers have a good chance of winning a few extra seats, mainly because the drop in Fine Gael support opens up the possibility of winning more Fine Gael transfers. On these poll numbers, Labour with a bit of luck, and if their candidates prove to be especially transfer friendly, could win 12 or 13 seats

If the fact that the Independents and Others support levels is being split across 307 candidates proves to be a significant issue here (I try to control for this, but…), or the fact that this grouping is a very wide and varied one (with transfers between candidates not likely to be as strong as intra-party transfers), the seat numbers for them may not be as large as estimated here. Against that, candidates from this grouping may well be better placed to win transfers from the political parties, whose supporters may be more willing to transfers to independents and smaller parties than to the other large parties.

My model was relatively close in relation to estimating seat levels by party/grouping on the exit poll for the 2011 election (coming within 3 seats, or less, of actual figures for all parties) . This may well not pan out this time, given the complications added by the boundary changes, as well as the growing strength (and sheer diversity within) the Independents and Others grouping.

Posted in Uncategorized | Leave a comment

Irish Times-Ipsos MRBI exit poll (26th February) – quick overview

Adrian Kavanagh, 26th February 2016

The Irish Times-Ipsos MRBI exit poll was published literally within an hour of polls closing

These figures suggest that support levels for both government parties have fallen by nearly ten percent relative to their 2011 figures. Both Fianna Fail and Sinn Fein make gains, although the extent of Sinn Fein gains may be relatively disappointing for that party given the support it enjoyed in most opinion polls across 2014 and 2015 and indeed up to the final week of the February 2016 General Election campaign.

The extent of Fine Gael losses may actually help Labour to hold more of its seat than might have been expected in recent analyses, indeed over and above the seat estimates outlined below, as Labour candidate may now be able to benefit from Fine Gael eliminations/transfers in a number of constituencies.

Fianna Fail are likely to be competitive in most constituencies. If the swing to the party is mirrored, or even stronger, in Dublin, they may well be in contention in some constituencies that seemed to be long shots for most of the campaign, including Dublin Central. But the swing to the party may also result in massive surpluses in constituencies where the party ran just one candidate, such as Laois, Limerick or Limerick City.

My initial run of the model estimates seat levels by party/grouping, based on a constituency level analysis of the exit poll as follows:

Fine Gael 47, Independents and Others 42, Fianna Fail 38, Sinn Fein 23, Labour Party 8

  • Labour, however, on these numbers have a good chance of winning a few extra seats, mainly because the drop in Fine Gael support opens up the possibility of winning more Fine Gael transfers. On these poll numbers, Labour with a bit of luck could win 12 seats
  • I accidentally allocated Fianna Fail two seats in Limerick City last night when I first ran this model, so numbers here have been amended. This indicates a potential trend in which Fianna Fail could have huge surpluses in constituencies where they have not run enough candidates.

If the fact that the Independents and Others support levels is being split across 307 candidates proves to be a significant issue here (I try to control for this, but…), or the fact that this grouping is a very wide and varied one (with transfers between candidates not likely to be as strong as intra-party transfers), the seat numbers for them may not be as large as estimated here. Against that, candidates from this grouping may well be better placed to win transfers from the political parties, whose supporters may be more willing to transfers to independents and smaller parties than to the other large parties.

My model was relatively close in relation to estimating seat levels by party/grouping on the exit poll for the 2011 election (coming within 3 seats, or less, of actual figures for all parties) . This may well not pan out this time, given the complications added by the boundary changes, as well as the growing strength (and sheer diversity within) the Independents and Others grouping.

Posted in Uncategorized | Leave a comment

Voter Turnout at the 2011 General Election: A Geographical Overview

Adrian Kavanagh, 26th February 2016

This post offers an in-depth geographical study of voter turnout levels at the last general election in 2011. The geographical variations in General Election 2011 turnout levels illustrated in this study are likely to be again, more or less, evident in today’s election.  Continue reading

Posted in Uncategorized | Leave a comment