Estimating the US Presidential election: applying national opinion poll levels to the state-level contests

Opinion polls ahead of November’s presidential election contest in the United States of America are pointing to a close contest between Barack Obama and his Republic Party challenger, Mitt Romney, with an averaging out of the most recent polls, following the Republican Party’s convention in Tampa, Florida, suggesting a virtual dead heat between the two candidates. But it will not be the candidate who wins the most votes that wins this election (as proved to be the case in the controversial 2000 contest and indeed other previous US presidential election contests) but the candidate who wins the most Electoral College votes. Continue reading →
Posted in opinion polls, US elections | 1 Comment

Gender Quota legislation: Challenges and opportunities

Adrian Kavanagh, 19th July 2012

The passing of gender quota legislation in the Dail today, linking the state funding of political parties to a requirement that female candidates will account for at least 30% of those parties’ total number of candidates, is a notable achievement and a timely one, given the desperately low levels of female candidatures as highlighted by previous posts relating to this topic on this site. But it does not fully solve the problem of low levels of female representation at national or local levels, although it is without a key first step in this process, as a number of challenges are posed in relation to the effective implementation of such quotas by the different political parties.  Continue reading →

Posted in Constituency Commission, Gender | Tagged , , , | 3 Comments

Estimating 2011 General Election seats levels using new Constituency Commission 2012 election boundaries

Adrian Kavanagh, 6th July 2012

Last month’s Constituency Commission report and the decision to reduce the number of Dail seats by 8 will have a profound impact on the result of, and the number of seats won by different parties at, the next general election. But what would the result of last year’s general election have been had these boundaries been in place for that contest. Continue reading →

Posted in Constituency Commission, Election boundaries, Election data, Tally figures | Tagged , , , , , , , , , , , , , , | 56 Comments

Political impacts of the 2012 Constituency Commission report: 2011 General Election party support estimates and changing political landscapes in the new constituency areas

Adrian Kavanagh, 25th June 2012 

The creation of new election boundaries for the next general election, associated with the reduction in the number of Dail seat numbers by eight, in the 2012 Constituency Commission report has fundamentally altered the rules of the electoral game and sets in play the stage on which the next election campaign will be fought. Party’s base levels of support by constituency, as related to their results in the 2011 General Election, have been changed with changes to these electoral boundaries. This post will attempt to decipher, based on tally figures in local newspapers where these are available, what these support levels would have been if the last general election had been fought in these new constituency areas. Where tally figures have not been published, there will be a discussion relating to the potential impacts of the changes being made to the constituencies in question. Continue reading →

Posted in Constituency Commission, Constituency information, Election boundaries, Election data, Tally figures | Tagged , , , , , , , , , , , , , , , , , , , , , , , , , , , , , , , | 2 Comments

Constituency Commission Report 2012 – An Overview

Adrian Kavanagh, 22nd June 2012

The lead up to the next general election began with a vengeance yesterday with the publication of the Constituency Commission report, recommending new constituency boundaries for the next European and Dáil elections. The main driver of boundary changes in the 2004 and 2007 reports had been the differential levels of population change across the state between 1996 and 2006, with particularly high levels of population increase in eastern Ireland and Dublin’s commuter hinterland contrasting with lower levels of population growth or even decline in areas such as Cork City and the west of Ireland. Population change again plays a role in shaping the changes being made in the latest report, but with less dramatic trends in the geography of population change across the state between 2006 and 2011 the main driver of change in the 2012 report relates to the decision to reduce the number of seats in Dáil Éireann. Continue reading →

Posted in Census2011 definitive figures, Constituency Commission, Constituency information, Election boundaries, Gender | Tagged , , , | Leave a comment

Some initial comments on 2012 Constituency Commision report

Adrian Kavanagh, 21st June 2012

The 2012 Constituency Commission report was published today and the level of changes in it are very dramatic and belie the generally conservative approach taken by the Commission in the previous two reports. There are three fewer constituencies, four less 3-seat constituencies and one more 4-seat constituency, making for the largest ever nunber of 4-seat general election constituencies in Ireland.  I hope to comment on these changes in more detail over the coming days, but for now here are some initial observations on these changes (which I’ll add to as the day progresses).

  • No changes were made to the existing European election constituency boundaries.
  • One pleasing aspect of this Constituency Commission report is the fact that there is a sense that this time they did pay attention to the public submissions. People living in the areas with the largest numbers of submissions relating to them (Swords, Leitrim, Terenure, Cork) generally tended to get what they had been looking for. I’m particularly pleased for the people of Leitrim for whom the division of the county was a major concern, although people in south Donegal and west Cavan will beg to differ.
  • One aspect that I’m not pleased with relates to the decision to keep the north-eastern part of Carlow in with Wicklow – while the population per TD ratio for Wicklow County would be 5.9% lower than the national average greater degrees of variance have been allowed by past Commissions to preserve county boundaries (Louth and Cavan-Monaghan in 2004, Cavan-Monaghan in 2007).  
Posted in Census2011 definitive figures, Constituency Commission, Constituency information, Election boundaries | Tagged , , | 2 Comments

European Union Fiscal Stability Treaty referendum 30th May 2012: An Overview

Adrian Kavanagh, 2nd June

The European Union Fiscal Stability Treaty referendum, held on 30th May 2012, was carried by a margin of 955,091 to 626,907, amounting to a percentage vote share of 60.37% for the Yes side. This was lower than the vote share won by the Yes side in other recent European Treaty referendum campaigns that were carried but was of course higher than the share won in the 2001 Nice Treaty and 2008 Lisbon Treaty referendum elections (Figure 1). Continue reading →

Posted in Election data, Electoral Geography (voting maps), Referendum elections, Voter turnout | Tagged , , , | Leave a comment

European Treaty referendum turnout levels in the Dublin City constituencies in the 2000s

Adrian Kavanagh, 31st May 2012

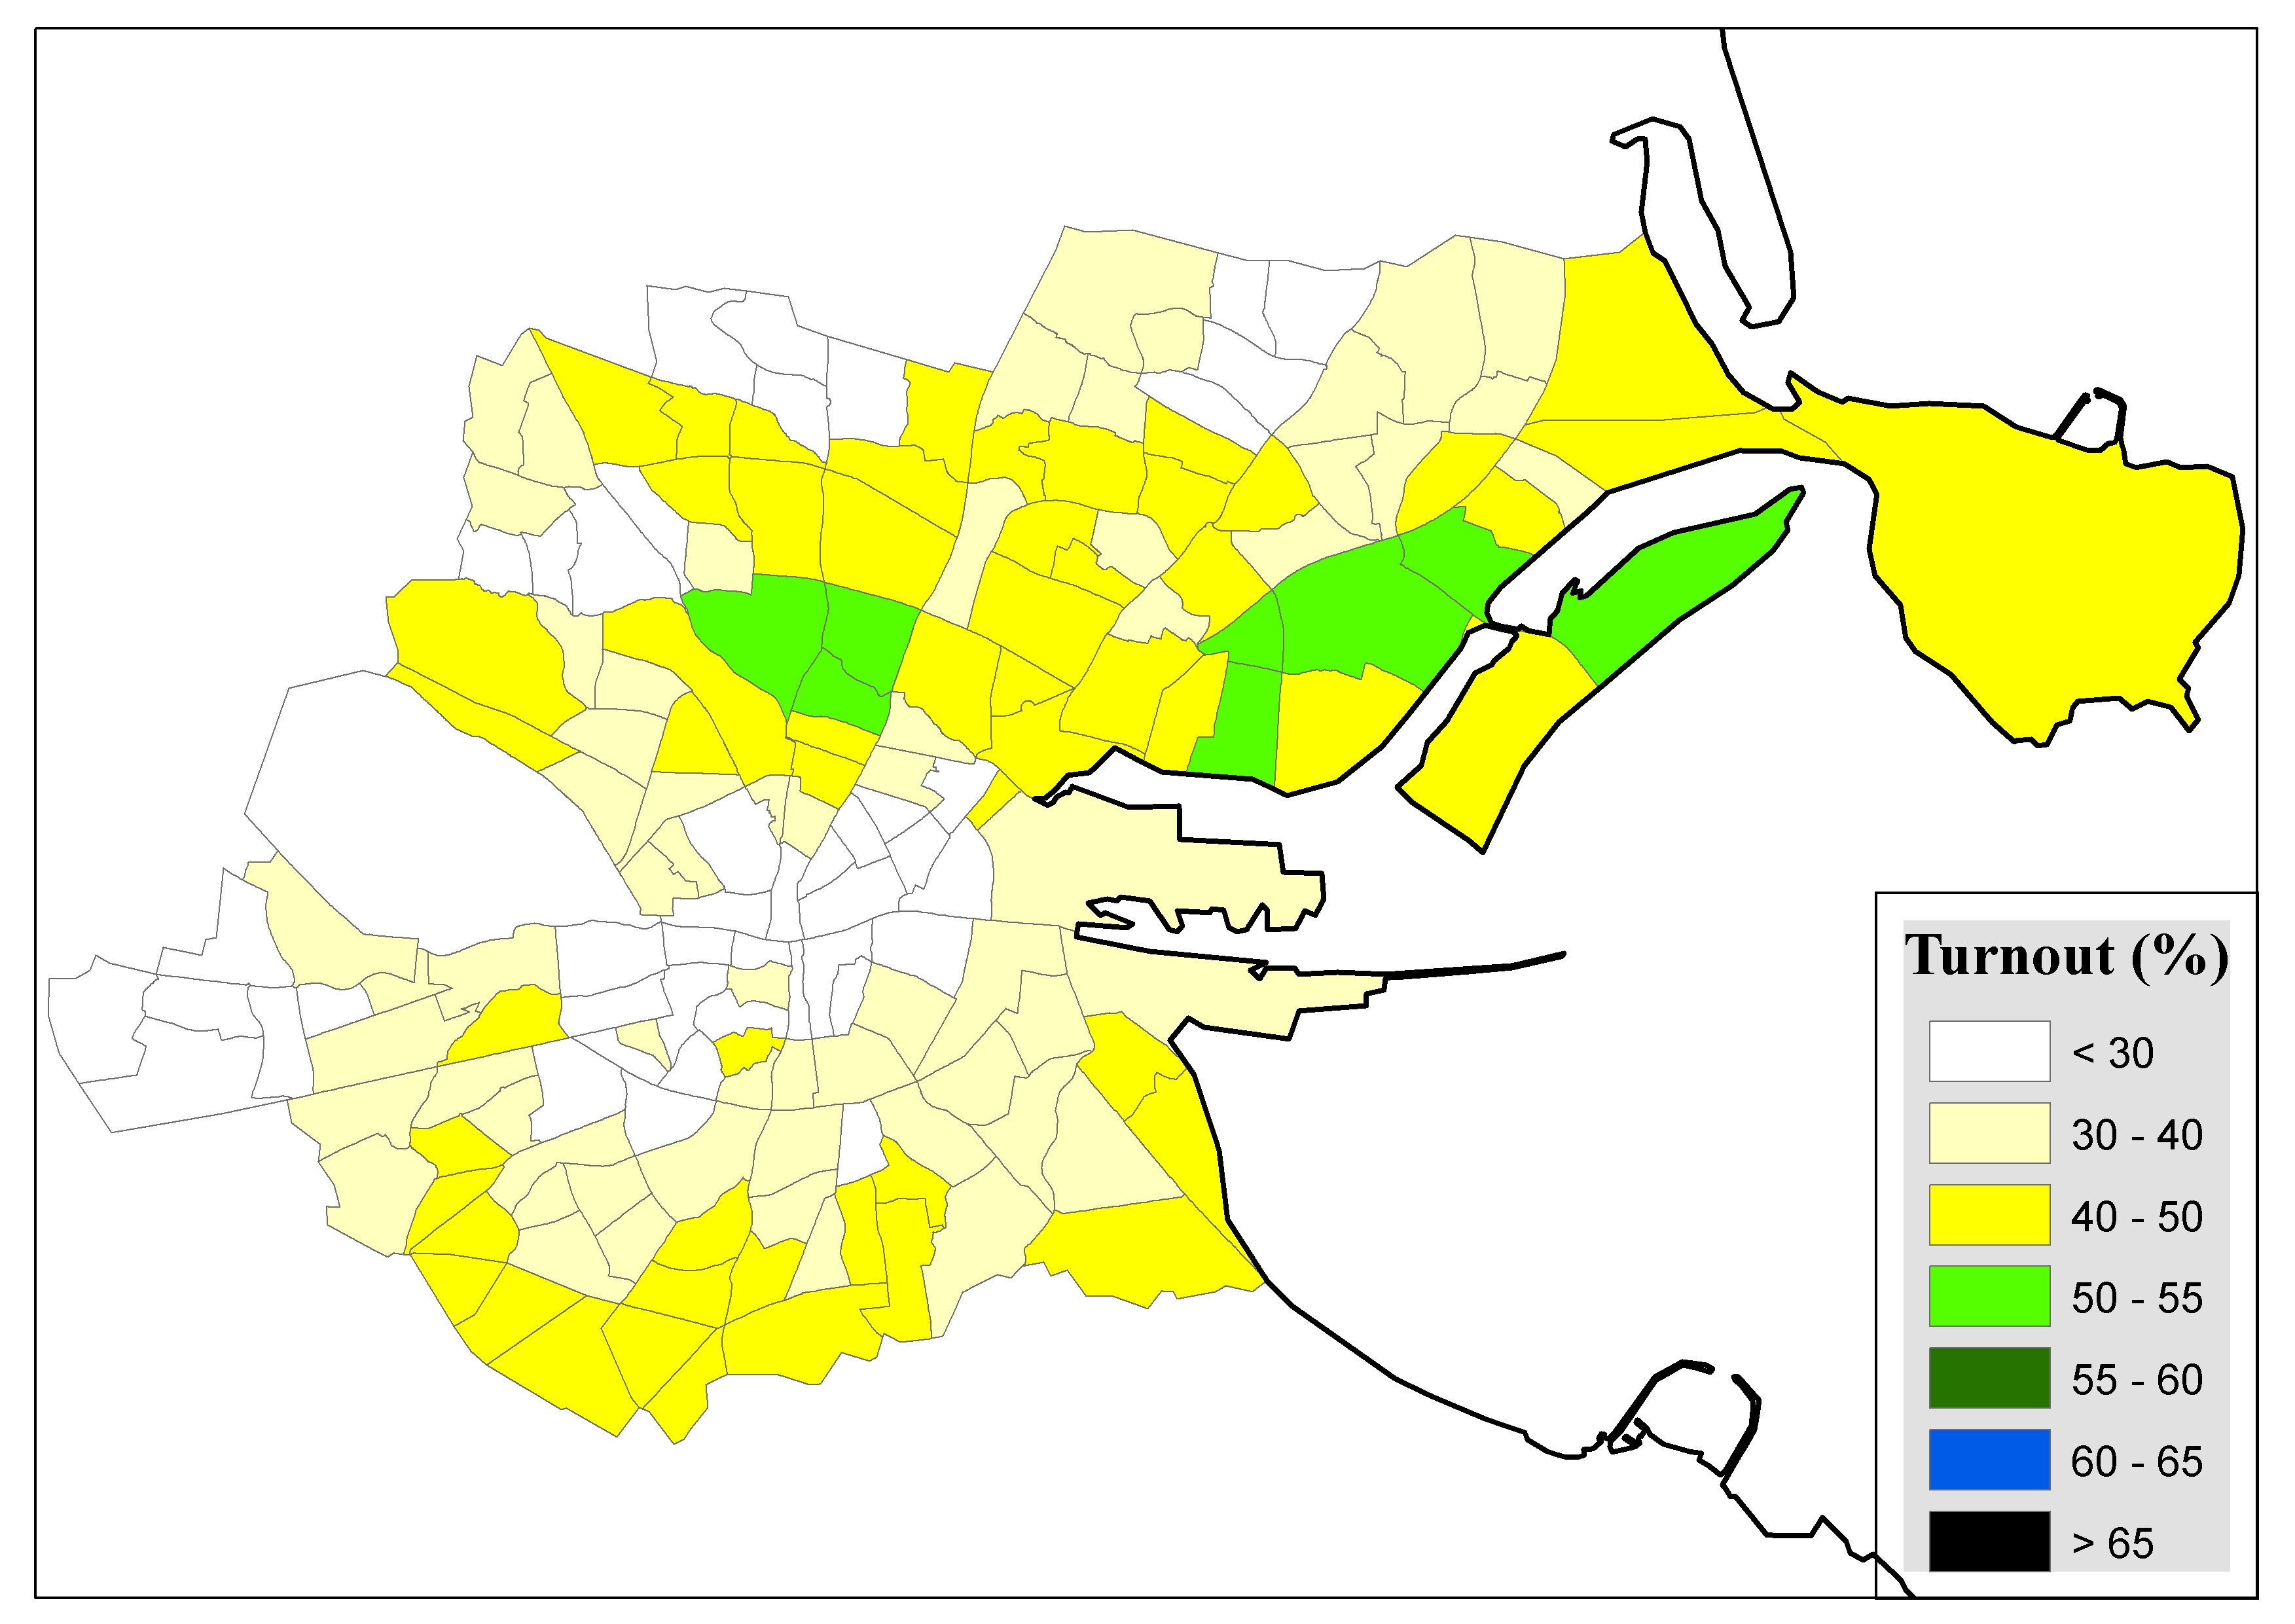
As polling in the European Fiscal Treaty referendum continues today, there is a lot of talk of low turnouts being recorded so far at different polling centres, so this would be an appropriate time to look at the extent of how turnout levels may vary between different areas. The previous post looked at how turnouts varied between different Dail constituencies, but this post will offer a more detailed study of turnout difference using turnout data for much smaller areas – electoral divisions in the Dublin City constituencies, based on ballot reconciliation turnout figures for these elections, as made available from the Dublin City Returning Officers official website.

Figure 1: Voter turnout by electoral division in the Dublin City constitiencies for the 2001 Nice Treaty referendum.

Continue reading →

Posted in Electoral Geography (voting maps), Referendum elections, Voter turnout | Tagged , , | 2 Comments

Which constituencies have the highest Yes or No votes and turnouts? A geography of European Union referendum votes

Adrian Kavanagh, 31st May 2012

A study of the previous five referendum elections relating to European Union treaties (Amsterdam 1998, Nice 2001, Nice 2002, Lisbon 2008 and Lisbon 2009) reveals a remarkable constistency in terms of regional turnout and voting trends in these contests with certain constituencies tending to consistently rank amongst the highest or lowest in the state in terms of turnout levels and support levels for the Yes or No side in these contests. In particular the lowest turnout levels and highest support for the No side in these campaigns tends to be found in the Donegal constituencies, while the highest turnout levels and highest support for the Yes side in these campaigns tends to be associated with the Dun Laoghaire and Dublin South constituencies.

Figure 1: Average voter turnout levels by Dail constituency in European referendum votes held between 1998 and 2009. (Apologies: File using GE2007 not GE2011 election boundaries)

Continue reading →

Posted in Constituency information, Electoral Geography (voting maps), Referendum elections, Voter turnout | Tagged , , | Leave a comment

New general election boundaries with a 158-seat Dail Eireann: the likely scenarios

Adrian Kavanagh, 25th May 2012

Following on the publication of final/definitive population statistics for Census 2011 on March 29th, the Constituency Commission has been completing the task of drawing up a new general (and European) election boundary report. They have also been tasked with deciding on a reduction in Dail seat numbers with the number of seats in the Dail to fall from  166, as present, to between 153 and 160; media reports today suggest they are likely to decide to opt for a 158-seat Dail Eireann.

Having decided on Dail seat numbers, the key thing that the Commission will be watching for in this review are constituencies whose population per TD ratios fall outside the 5% variance limit – that is, whose population per TD ratios are either more than 5% above, or below, the state average for this. In the case of a 158-seat Dail, the state average would be 29,040 people per TD, meaning that the Commission would need to look at/consider making changes to constituencies with population per TD ratios lower than 27,588 people per TD and greater than 30,492 people per TD. In these cases, the Commission must consider whether they need to make changes to the boundaries/seat numbers for these constituencies. On past precedents, they may opt not to make changes if the level of variance is not much higher than this 5% limit (as happened in the case of Cavan Monaghan in both the 2004 and 2007 revisions) but they must make changes if the level of variance exceeds 7.89% – the maximum level of variance permitted by past commissions (Mayo East in the 1983 revisions) – constituencies falling into this category would have constituencies with population per TD ratios lower than 26,74people per TD and greater than 31,331 people per TD. This chart helps identify the constituencies whose boundaries may/will need to be changed.

Extent to which constituencies’ population per TD ratios vary from state average for different seat number options (and likelihood of boundary changes being made to these – as highlighted in yellow/blue)

So what are the likely changes to be made in relation to our current Dail constituencies? Continue reading →

Posted in Census2011 definitive figures, Constituency Commission, Constituency information, Election boundaries | Tagged , , | 2 Comments