Voter turnout in Dublin City in 2011 – a geographical perspective

Adrian Kavanagh, May 3rd 2012

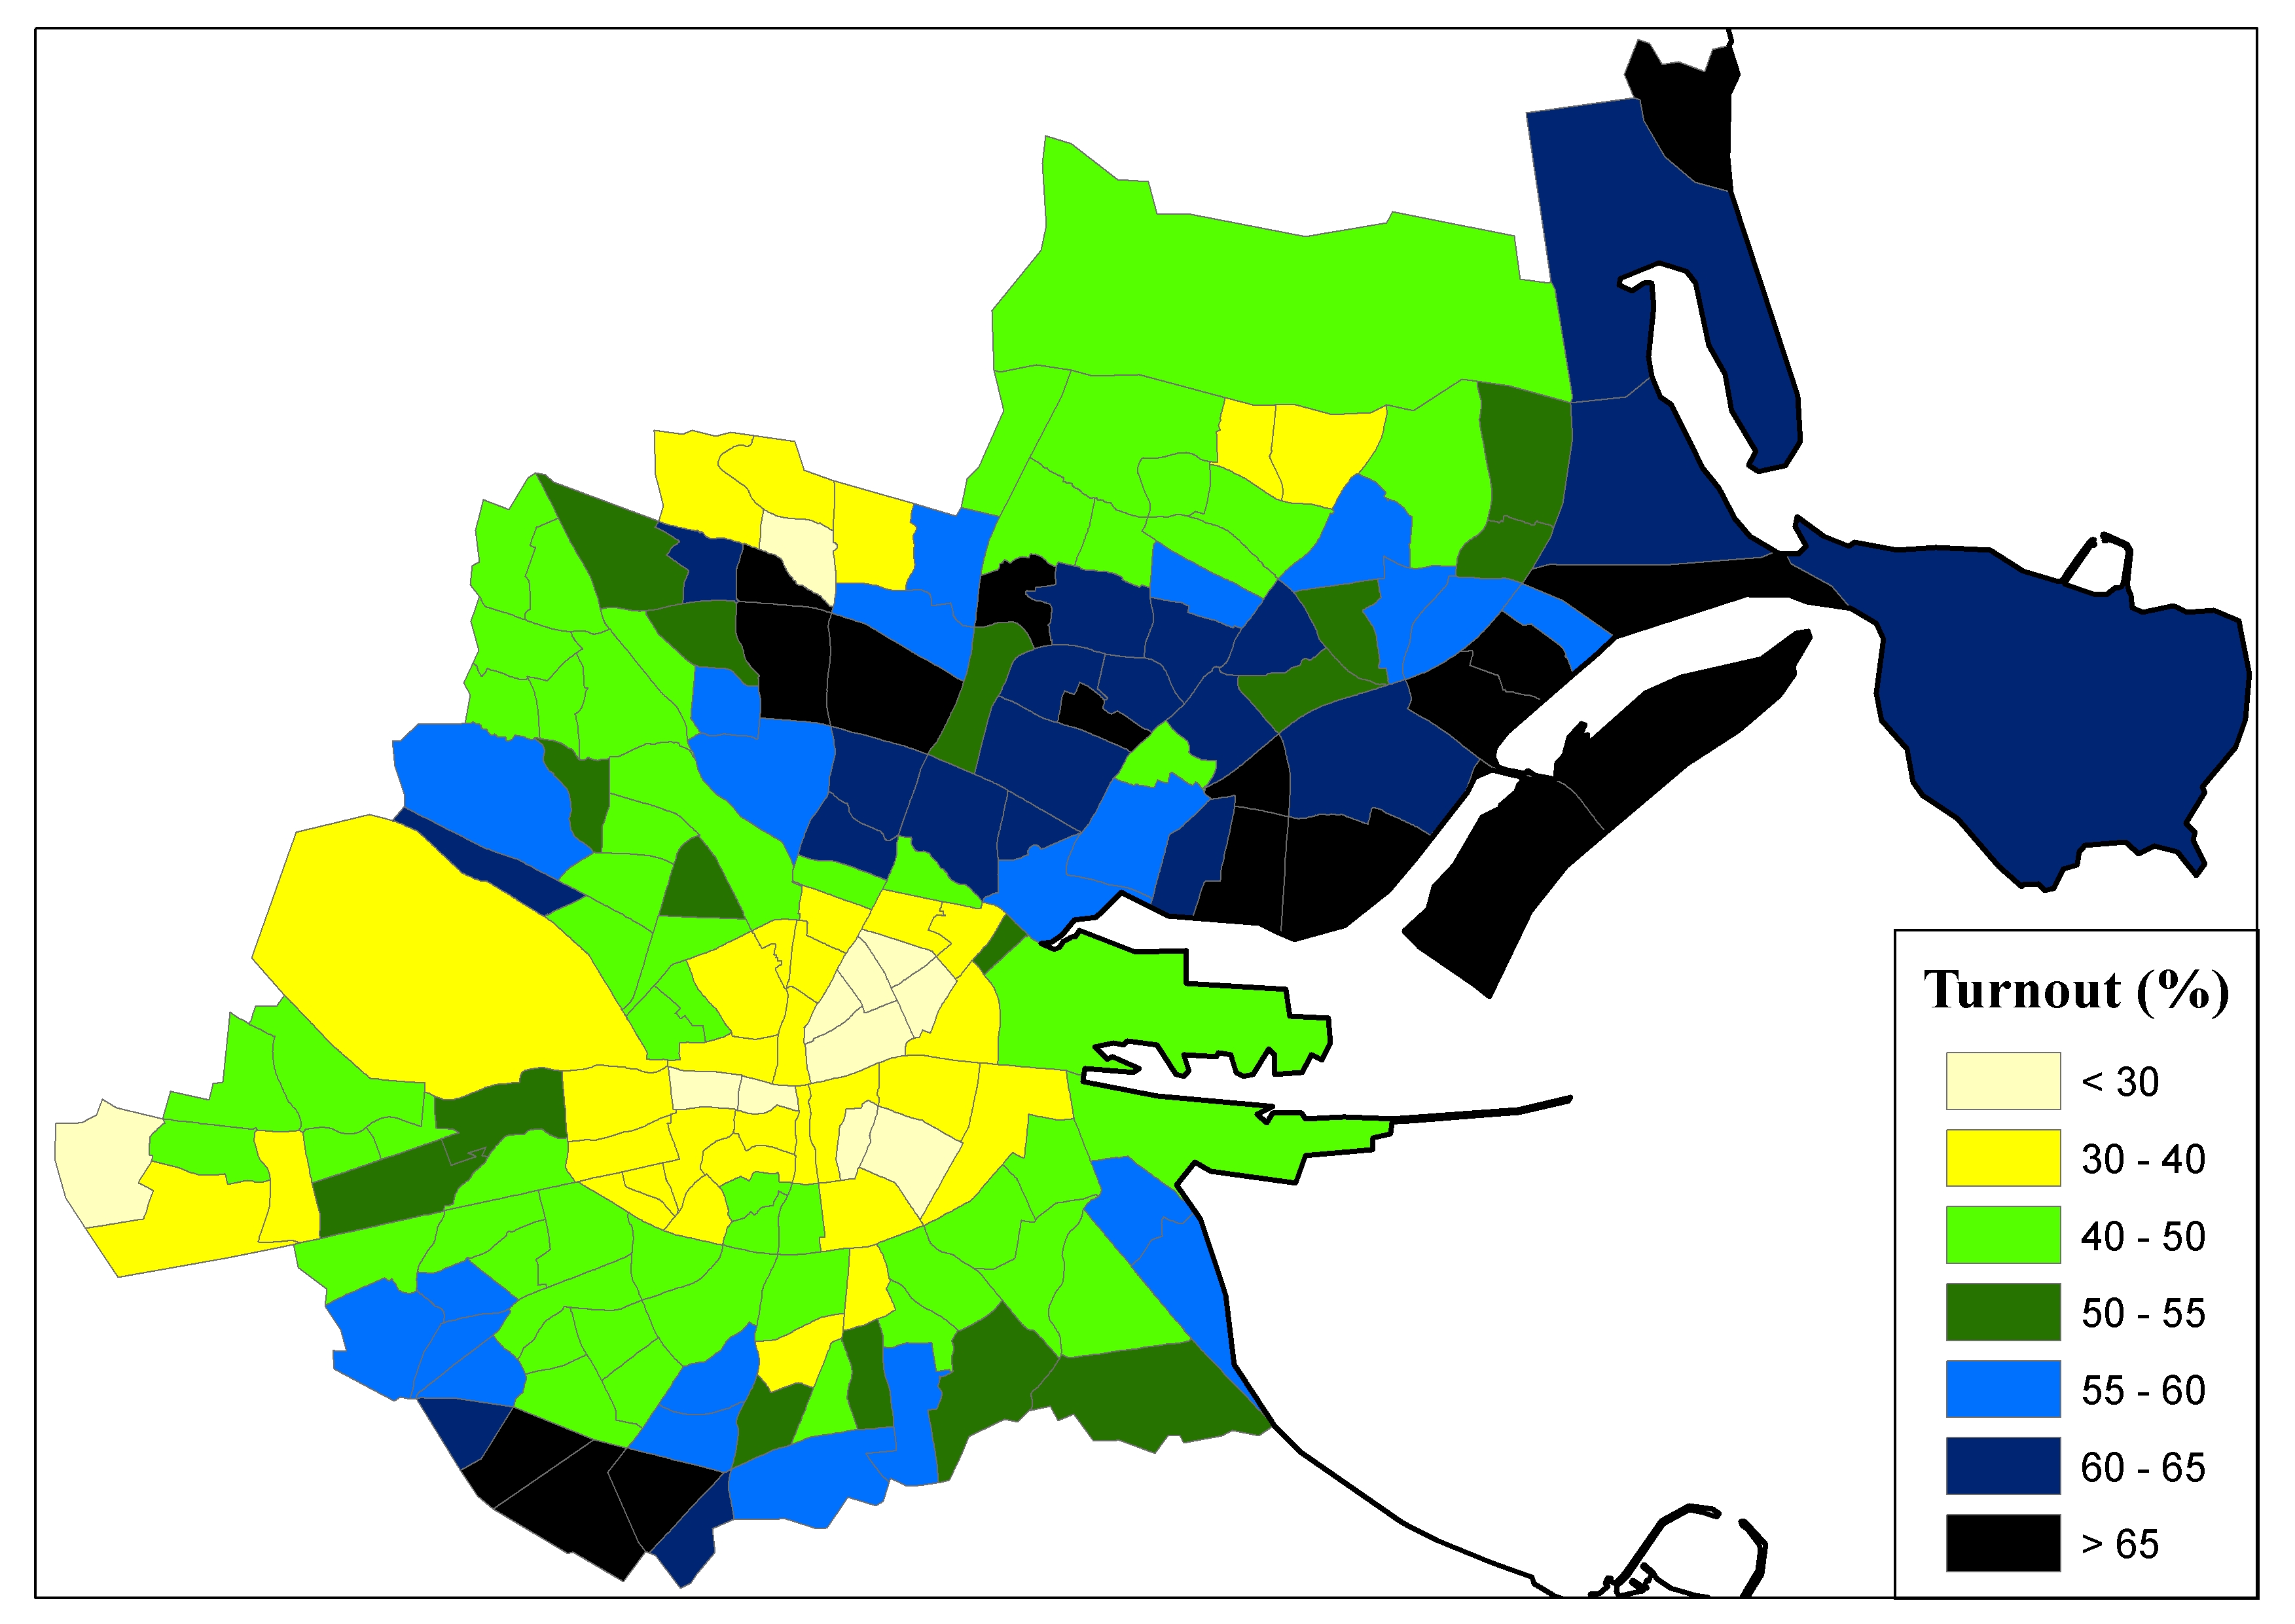
Voter turnout in Dublin City constituencies by electoral division, 2011 General Election

The issue of voter turnout has largely disappeared from the Irish media and political commentariat’s attention over the past few years, with concerns over issues to do with low political participation levels, and indeed especially low participation rates amongst certain social groups and in certain areas, being supplanted by other concerns involving the electoral process and other political reform issues. This is a far cry from the early 2000s in which the issue of low turnout received significant attention from the media, especially in the lead up to the 2002 General Election. In some ways this does reflect a growing improvement in Irish electoral participation levels since the low levels attained in the late 1990s and 2000s, but it also ignores the fact that some turnout levels in some parts of the state remain relatively low and contrast unfavourably with the national average turnout rate. Differential turnout levels between different areas, different social groups and different demographic groups is a concern because, as claimed by political scientist, Arend Lijphart, “unequal participation spells unequal influence”. Differential turnout levels do shape election results (with parties/candidates drawing their main support from low turnout groups and/or areas tending to be placed at a disadvantage relative to other parties/candidates), but they can also influence policy responses (for instance, contrast the differing response from the government to the high-turnout pensioners and low-turnout students protests following the 2008 budget) and the degree to which politicians will engage with certain areas and groups.

This post will study voter turnout levels in the Dublin City general election constituency, based on an analysis of the online (ballot-reconciliation) turnout figures provided by the Dublin City Returning Officer’s office for recent elections and referring to earlier research relating to past elections, based on similar ballot-reconciliation turnout figures, in addition to my analysis of marked-register generated turnout figures, emerging from a joint project involving the Geary Institute in UCD and the Department of Geography in NUI Maynooth.

The areas covered by the Dublin City Returning Officer includes all of the electoral divisions included within the boundaries of the Dublin Central, Dublin North Central, Dublin North East, Dublin North West, Dublin South Central and Dublin South East constituencies. The Constituency Commission’s map of these constituencies may be viewed here. This includes the entire territory of the Dublin City local authority area, but also parts of Fingal and South Dublin counties which currently fall inside the areas covered by the aforementioned constituencies (e.g. Howth, Sutton, Baldoyle and Portmarnock in Dublin North East, Kimmage Manor/Perrystown areas in Dublin South Central).

The average reported turnout rate across the six constituencies in General Election 2011 was 66.5%, up from a level of 59.3% for the 2007 contest and 55.9% for the 2002 contest. While turnout levels within the City constituencies had increased by over ten percent within a period of (less than) nine years, the average Dublin City turnout level still remained lower than the national average (69.9%), in keeping with the general trend in turnout geographies for general and local elections wherein turnout levels tend to be higher in rural areas/constituencies than in urban areas/constituencies. However the gap between the national and City turnout averages (3.4%) was decidedly lower than the gap that existed in 2007 (7.7%) and 2002 (6.7%). In part the narrowing of this gap may be explained by the addition of the higher turnout Portmarnock area into Dublin North East in the 2007 Constituency Commission boundary revisions.

As the map above shows, there were significant differences in turnout levels between different parts of the Dublin City (constituencies) area in the 2011 contest. The very high turnout levels within this area were associated with mainly middle class and mainly settled (i.e. areas experiencing relatively little population in-migration as compared with other parts of the city) parts of the city, including Sutton, Raheny, Clontarf, Drumcondra, Glasnevin and Ashtown in the North City area and the Terenure area in the southern part of this area. Lower turnout levels are associated with the more working class parts of the area, such as Ballymun, Darndale and Cherry Orchard, in addition to the flatlands area of Rathmines. That said, turnout levels were relatively higher in the older working class communities, with good turnout levels being observed for the Cabra area. 

With the exception of the Phoinex Park electoral division in the west, the main concentration of lower turnout levels however was focused on the Dublin Inner City area with turnout levels in all of the inner city electoral divisions (with the notable exception of the Tenters area, or the Merchants Quay D electoral division, in the South West Inner City) being decidedly lower than the City average and indeed the national average. This is very much in keeping with the trends observed in other electoral contests held during the 2000s in which the Dublin Inner City area has emerged as THE low turnout area, not only within Dublin but within the state as a whole. When I commenced my turnout researches back in the 1990s areas like West Tallaght and North Clondalkin would have had lower turnouts than the inner city areas (mainly due to the more settled and older inner city population relative to the younger populations in the newer communities in the werst of Dublin, but the influx of younger, mainly professional, people – the “gated apartment” communities –  in the late 1990s and 2000s into the inner city pushed turnouts down further in the early 2000s, resulting in levels falling below those in other low turnout areas such as Ballymun, North Clondalkin and West Tallaght. The knock-on effect was of a politically marginalised working class inner city community becoming even more marginalised because of the influx of young professionals, who tended not to vote in large numbers, or rather not vote in the area in large numbers (a significant proportion travelling “home” to vote on election day instead of casting their vote in their inner city place of residence).

Unlike states such as the USA which calculate voter turnout levels as a percentage of the valid adult population, turnout levels in Ireland are calculated based as a percentage of the numbers on the electoral register. Register inaccuracies will mean that reported turnout levels will be somewhat different to what they are in actuality. In most rural areas, but also the settled and middle class inner suburban areas within Dublin City, the numbers on the electoral register tend to be over-estimated thus suggesting that the real turnout rate is probably higher than the recorded rate in these areas, which would already be characterised as higher turnout areas. In areas characterised by areas of high levels of population mobility, such as South Lucan and Blanchardstown but also the Dublin Inner City, the numbers of people on the register tend to be significantly smaller than the valid adult population in those areas and the reported turnout level as a result would probably be signficantly higher than what the actual turnout levels would be in these areas, a significant factor given that these also tend to be low turnout areas based on reported rates. Add in the fact that a significant number of people on the register in highly mobile, low turnout, areas such as the inner city may no longer be resident there, and the potential for real turnout levels in these areas to be significantly lower than the recorded rate is further heightened. Thus real turnout levels are probably higher than reported rates in the high turnout areas and lower than reported rates in the low turnout areas and the “real” geographical differences in turnout propensity between high and low turnout areas, whether at the state level or within Dublin City, are probably significantly higher as a result.
Voter turnout, by electoral division, for the 2011 Presidential Election in the Dublin City constituencies.

Voter turnout levels for other elections general tend to display the same spatial, or geographical, trends in the Dublin City constituencies, although turnout levels in these contests will tend to be lower than for general election, as in keeping with the second order elections model in political science. Turnout differences between the general election and presidential election contests of 2011 offer good evidence of this. As the map above shows, turnouts for the 2011 Presidential Election contest were again highest within the Dublin City constituencies in the largely middle class and settled inner suburban areas, such as Raheny, Clontarf and Glasnevin in the North City area (as well as Sutton and Portmarnock) and Terenure in the South City area. By contrast, the lowest turnout levels were associated with the more working class areas and the inner city.

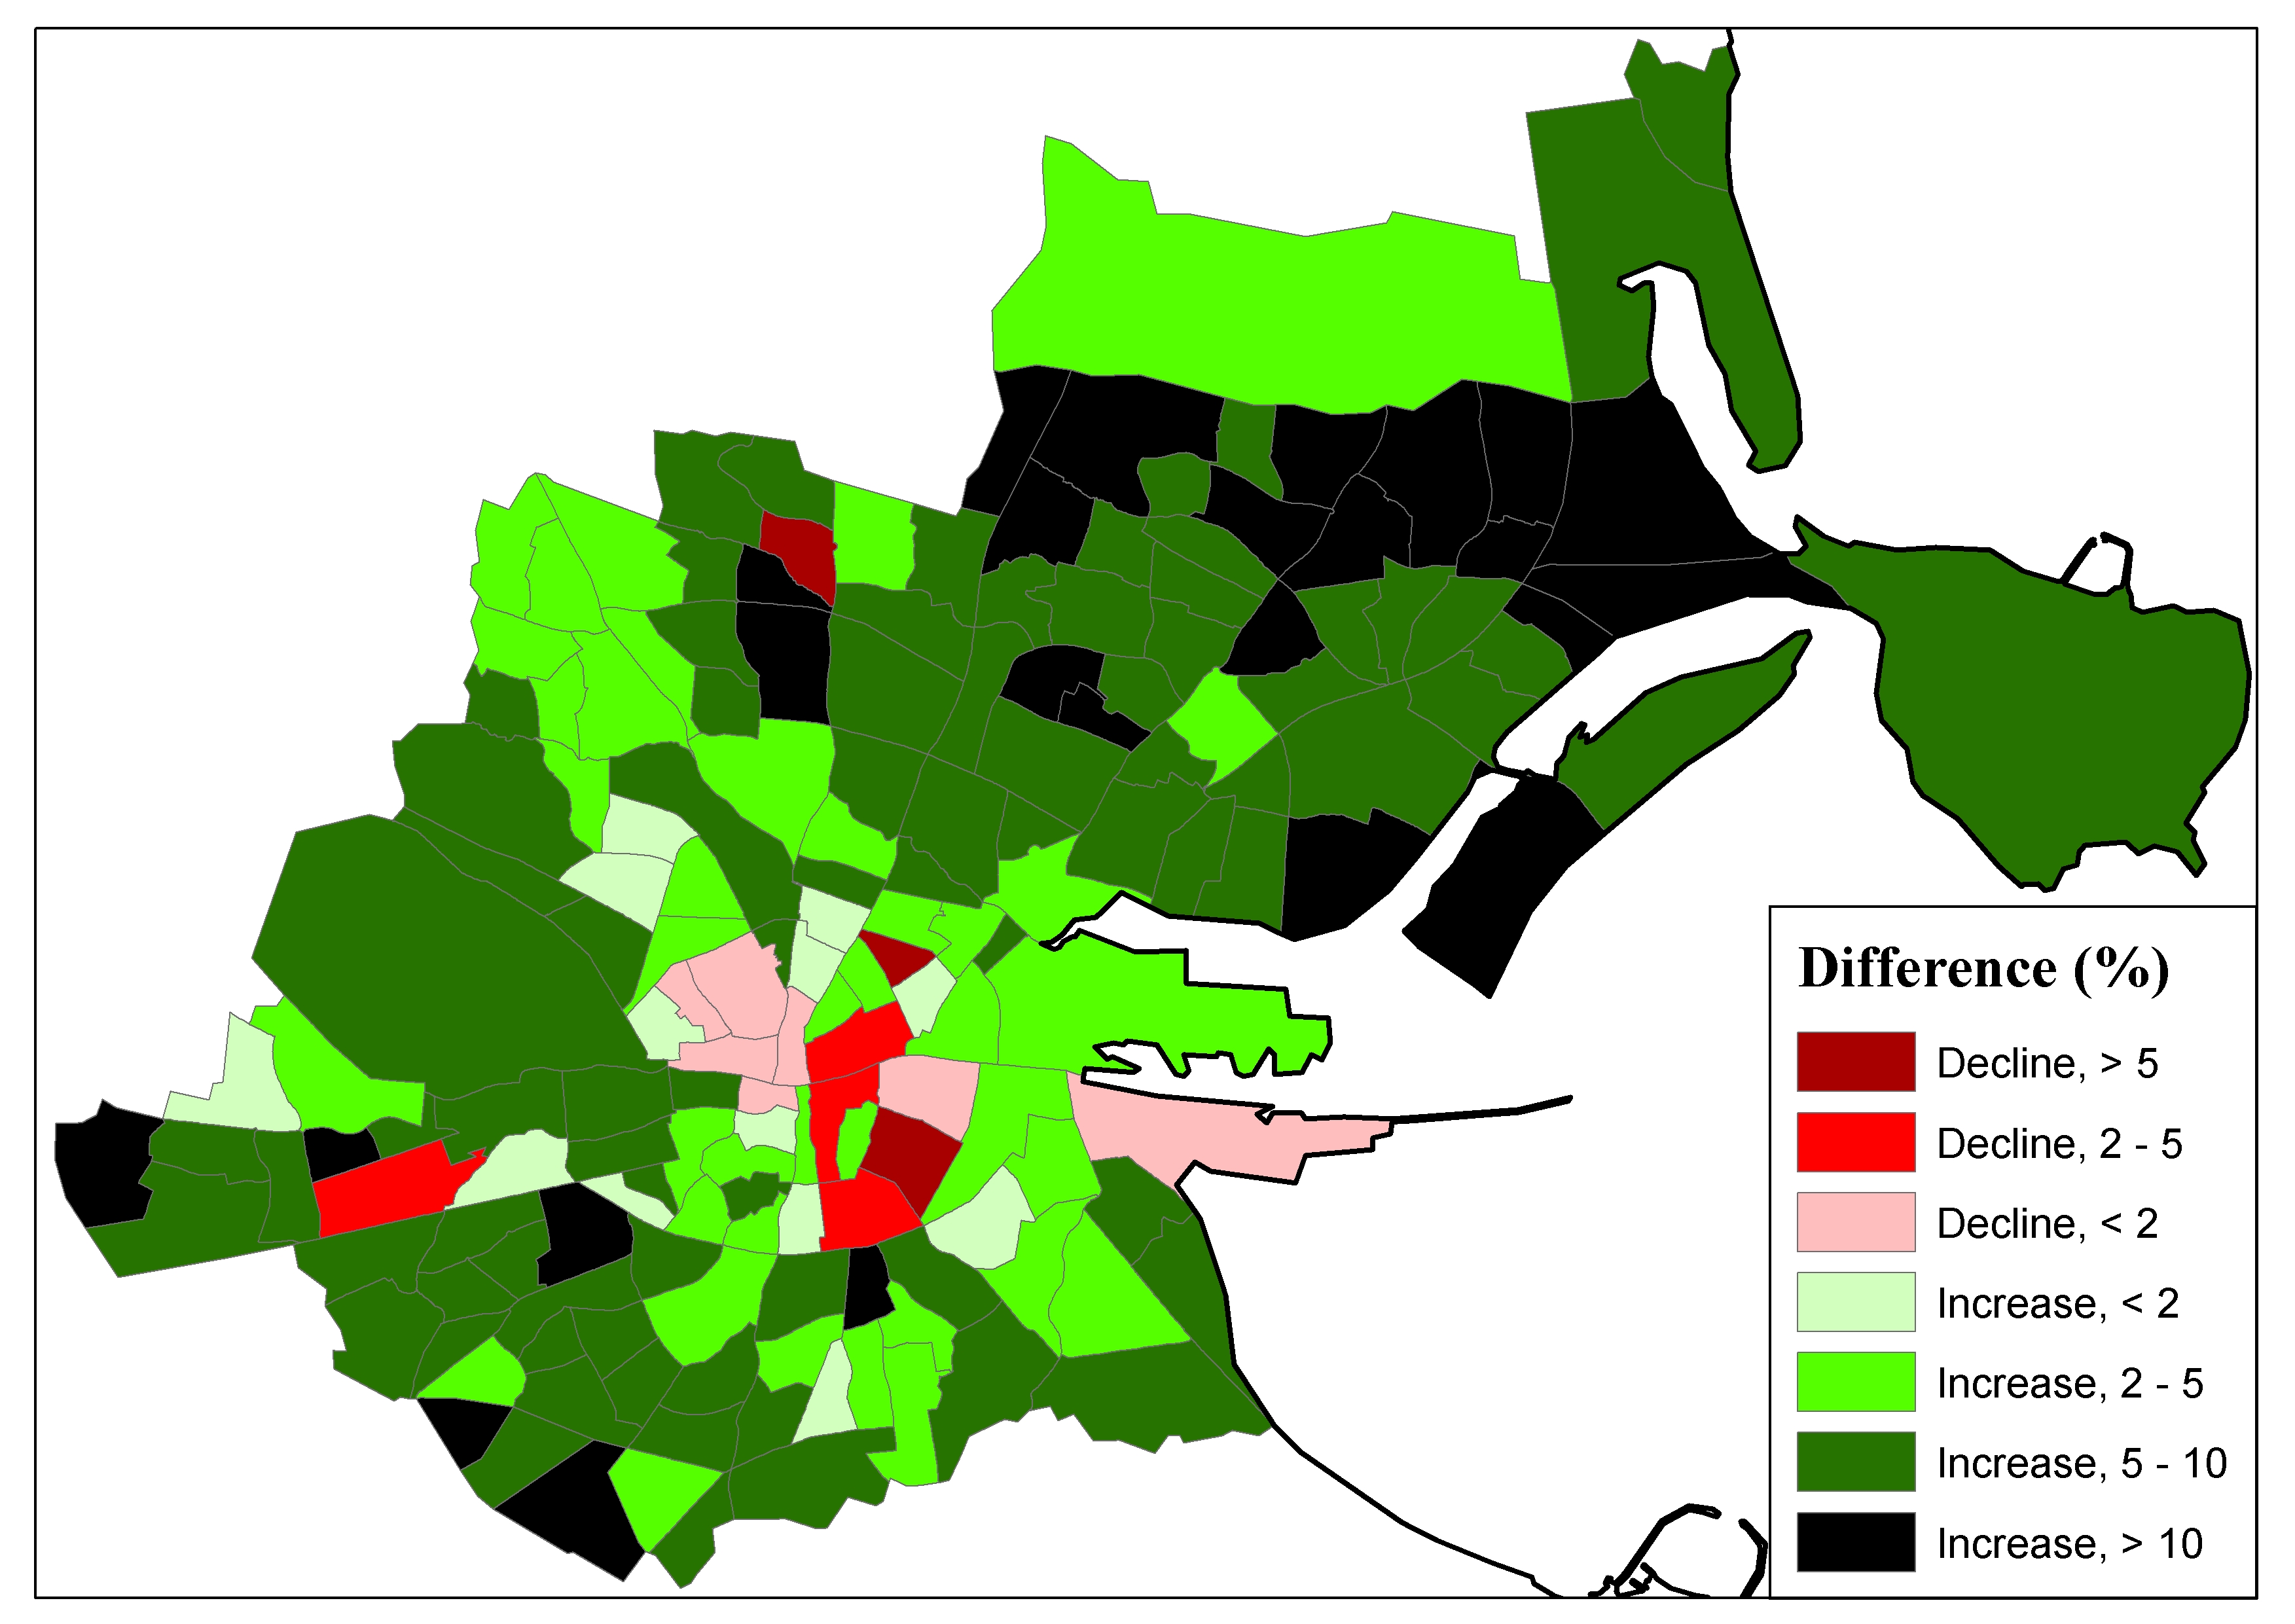
Turnout differences, by electoral division, within the Dublin City constituencies between the General Election and Presidential Election.

The map above shows that there was an interesting class dimension to the pattern of turnout differences between the general and presidential election contests. While turnout levels declined between the two contests, the difference in turnouts between these two contests tended to be higher in the more working class areas and to be less significant in the more middle class areas.

An interesting class dimension also emerged when studying the level of turnout change between the most recent general election contests. As noted earlier, turnout levels increased in the Dublin City constituencies by over ten percent, on average, across the three general election contests held between 2002 and 2011. But the rate of turnout change between different general election contests was not the same across all of the City area – there were notable class dimensions to the level of turnout increase between the 2002 and 2007 general elections and the 2007 and 2011 contests and this in turn had an impact on political support levels in the 2007 and 2011 elections.
Turnout change, by electoral division, in the Dublin City constituencies area between the 2002 and 2007 General Elections.

The map above shows that, while most parts of the City area experienced an increase in turnout levels between 2002 and 2007, the most dramatic level of increase tended to be associated with the more middle class parts of the city. While turnout increases of close to, or more than, ten percent between the 2002 and 2007 elections were observed in middle class areas such as Sutton, Clontarf and Terenure, the level of turnout increase was less notable in the more working class areas, with the exception of the Cherry Orchard and Darndale areas, which were starting from an exceptionally low turnout base based on those areas’ low 2002 turnout levels. Turnouts levels actually fell in parts of the inner city and this might well be put down to the increased levels of population mobility impacting on these areas during the early to mid 2000s. The traditional “main parties” seemed to have been the main beneficiaries of this increase in voter numbers. In terms of the political changes between these two contests, it would appear that Fianna Fail (with an extra 4,360 votes) and Fine Gael (with an extra 7,020 votes) took a significant chunk of the increased vote numbers in the Dublin City constituencies. While Fianna Fail almost held their own in terms of seat levels (losing out on Ivor Callelly’s Dublin North Central seat due to the change in seat numbers brought in by the 2004 Constituency Commission), Fine Gael gained seats in Dublin North East and Dublin South East while also establishing a base in Dublin Central that Paschal Donohoe would build from to go on to win a seat in 2011. By contrast, Sinn Fein’s number of votes fell by 2,536 (and 1.8%) in the Dublin City constituencies despite the overall increase in voter numbers and the party came close to losing its Dublin South Central seat in this contest.
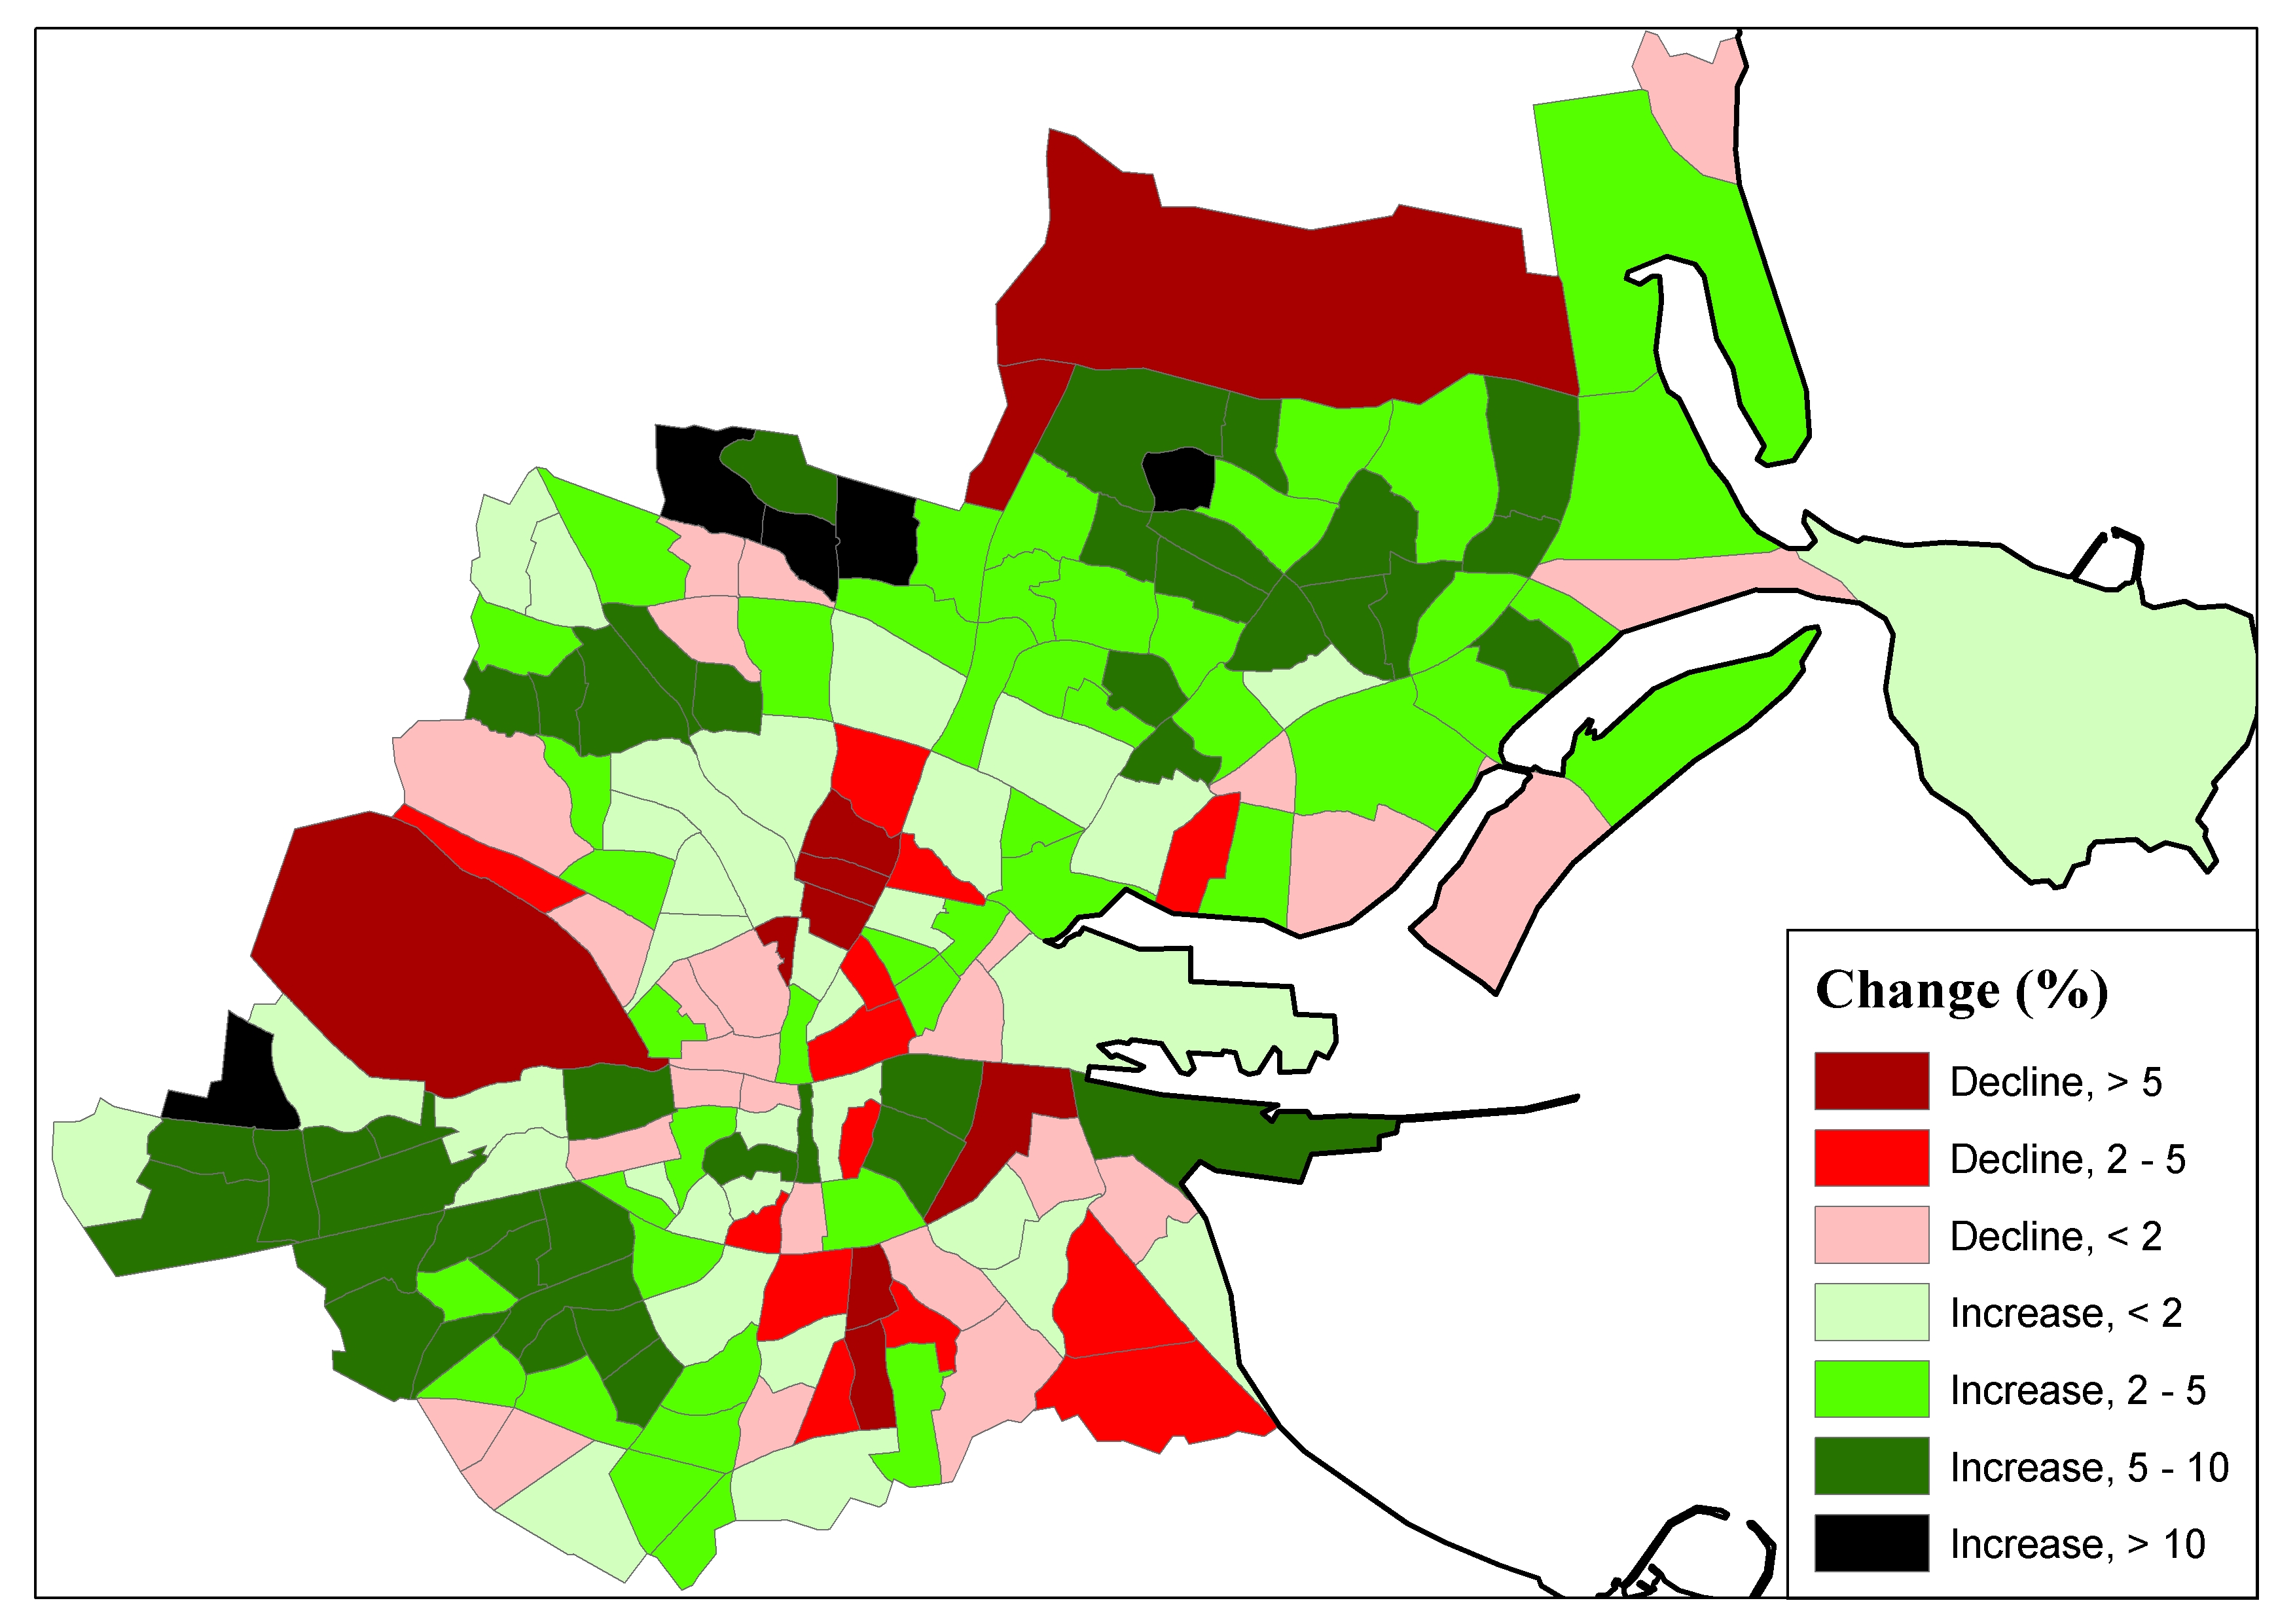
Turnout differences, by electoral division, between the 2007 and 2011 General Elections in the Dublin City consituencies area

By contrast, while the first wave of general election turnout increases in the 2000s seems to have been mainly focused on the more middle class area, the big hidden story of the 2011 General Election was the levels to which turnouts increased by in urban working class communities and this is especially evident in a contrast between the turnout levels for the 2007 and 2011 contests in the Dublin City constituencies. By and large, the areas within Dublin City experiencing the most significant turnout increases at the 2011 General Election were the more working class parts of the city, including Ballymun, Ballyfermot, Crumlin and the traditional working class parts of the inner city. Turnout increases were less defined at this election in the more middle class areas and even fell signficantly in some areas, such as Drumcondra. The signficant cluster of declining turnout in the Drumcondra area is itself interesting given that this election was not being contested by a high profile politician local to that area, showing that there can be candidate effects on turnout propentity levels in areas. In terms of political impacts of the increased turnout levels, it can be seen that Sinn Fein’s number of votes increased between the two contests by 6,374 and they translated this increased support level into seat gains in Dublin Central and Dublin North West and a solidifying of their Dublin South Central seat. The extent of the Labour support increase within these constituencies was even more dramatic, with the party gaining a seat in all of the constituencies bar Dublin Central and winning nearly forty thousand (39,677) more votes than the 2007 vote total with their share of the vote up from 15.7% to 31.6%. It was a mixed result for the two traditional parties, which would tend to be more relianct on middle class support from these constituencies; while Fine Gael made significant gains, increasing their number of votes by 26,844 (increasing their share of the vote from 16.9% to 27.3% and gaining seats in Dublin Central and Dublin South East), Fianna Fail lost 58,280 votes across these six constituencies (down from 39.3% to 11.8%) and lost all of the nine seats that the party had won in these constituencies in the 2007 election. The improved fortunes of Labour, Sinn Fein and other left wing groups in the Dublin City constituencies was no doubt in part related to the collapse in Fianna Fail support but these parties/groupings would have also – taking account of their atypical urban geographies of support – have benefitted from the increase in vote numbers in a number of Dublin City working class communities.

Posted in Election data, Electoral Geography (voting maps), Voter turnout | Tagged , | 7 Comments

Census 2011, general election constituencies and county boundaries

The focus of many submissions to Constituency Commissions has to do with concerns over existing, or potential, breaches of county boundaries in respect to the creation/changing of Dail constituency boundaries. This post here reviews the potential scenarios involving the different counties in relation to the potential redressing of existing county boundary breaches or the likelihood of new county boundary breaches in light of the population change figures published last June in the provisional Census 2011 figures and confirmed recently with the publication of the definitive census population figures. The reduction in Dail seat numbers will be as big an issue – if not even a bigger one – for the Commission to consider this time around and the post will consider this with specific focus on the impact of the Commission opting to choose larger or smaller seat number options from the range (153-160 Dail seats) open to them. Continue reading →

Posted in Census2011 definitive figures, Constituency Commission, Constituency information, Election boundaries | Tagged , , | 2 Comments

Shape of new general election boundaries if the Constituency Commission opt for a 156-seat Dail (updated based on definitive Census 2011 figures)

Adrian Kavanagh, 30th March 2012

A new Constituency Commission report on election boundaries (for general and European elections) is likely to be published in the coming weeks after the publication of final/definitive population statistics for Census 2011 by the Central Statistics Office yesterday. This post will consider what might happen our current constituency configurations if a 156 seat tally was agreed on for the next Dail. Continue reading →

Posted in Census2011 definitive figures, Constituency Commission, Constituency information, Election boundaries | Tagged , , | Leave a comment

Shape of new general election boundaries if the Constituency Commission opt for a 158-seat Dail (updated based on definitive Census 2011 figures)

Adrian Kavanagh, 29th March 2012

A new Constituency Commission report on election boundaries (for general and European elections) is likely to be published in the coming weeks after the final/definitive population statistics for Census 2011 were published today.  This posts follows on the previous posts in this series which updates the analysis carried out previously for 154-Dail seat and 160-Dail seat scenarios to consider what options the Constituency Commission might face if they decide to opt for a 158-seat Dail Eireann. Continue reading →

Posted in Census2011 definitive figures, Constituency Commission, Constituency information, Election boundaries | Tagged , , | Leave a comment

Shape of new general election boundaries if the Constituency Commission opt for a 154-seat Dail (updated based on definitive Census 2011 figures)

Adrian Kavanagh, 29th March 2012

A new Constituency Commission report on election boundaries (for general and European elections) is likely to be published in the next few weeks following the publication today by the Central Statistics Office of definitive population figures for Census 2011. This post will consider what might happen our current constituency configurations if a 154 seat tally was agreed on for the next Dail. Continue reading →

Posted in Census2011 definitive figures, Constituency Commission, Constituency information, Election boundaries | Tagged , , | Leave a comment

Shape of new general election boundaries if the Constituency Commission opt for a 160-seat Dail (updated based on definitive Census 2011 figures)

Adrian Kavanagh, 29th March 2012

A new Constituency Commission report on election boundaries (for general and European elections) is likely to be published in the coming weeks after the publication of final/definitive population statistics for Census 2011 by the Central Statistics Office today.

This post will consider what might happen our current constituency configurations if a 160 seat tally was agreed on for the next Dail and in light of the provisional Census 2011 population levels published by the CSO last year. While the Commission has a range of options to choose from between 153 and 160 in terms of seat numbers for the next Dail, the likelihood is they may opt for a seat tally towards the upper range of this as continued population growth may require seat tallies to be constantly changing if they opt for a seat tally at the lower end of this scale.

The key thing that the Commission will be watching for in this review are constituencies whose population per TD ratios fall outside the 5% variance limit – that is, whose population per TD ratios are either more than 5% above, or below, the state average for this (in the case of a 160-seat Dail, the state average would be 28,677 people per TD). In these cases, the Commission must consider whether they need to make changes to the boundaries/seat numbers for these constituencies. On past precedents, they may opt not to make changes if the level of variance is not much higher than this 5% limit (as happened in the case of Cavan Monaghan in both the 2004 and 2007 revisions) but they must make changes if the level of variance exceeds 7.89% – the maximum level of variance permitted by past commissions (Mayo East in the 1983 revisions).

So what might happen to our current constituencies in the light of the decision to reduce the number of Dail seats and the population changes outlined in the definitive 2011 Census population by area figures, if the Constituency Commission were to opt for a 160-seat Dail Eireann?

Continue reading →

Posted in Census2011 definitive figures, Constituency Commission, Constituency information, Election boundaries | Tagged , , | 2 Comments

Levels of variance per Dail constituency based on definitive Census 2011 population figures

Adrian Kavanagh, March 29 2011

The definitive Census 2011 population figures have been published today. Election boundary changes (for general and European elections) will be made on the basis of these, but this time are taking place in the context of a decision by government to advise a reduction in Dail seat numbers by between 6 (160 seats) and 13 (153 seats). So what do these population figures mean in terms of which constituencies may, or may not, be likely to have their election boundaries changed following on the upcoming Consituency Commission report, especially given that this body effectively will have eight different options in terms of total Dail seat numbers to choose from? The following document, which outlines the degree to which each constituency’s population per TD ratio will vary (in percentage terms) from the state average for each of the different seat number options open to the Commission, should help in regard to this.

Extent to which constituencies’ population per TD ratios vary from state average for different seat number options (and likelihood of boundary changes being made to these – as highlighted in yellow/blue)

What is evident from this analysis is that the main driver of change in relation to the redrawing of Dail election boundaries this time will probably be more so the decision to reduce Dail seat numbers over and above those changes required by differential levels of population change within the state. Had the number of seats remained at 166, changes to constituency boundaries would have been absolutely necessary in just 12% of cases (where level of variance exceeds 7.89%) and would have been probable in a further 21% of cases (where level of variance exceeds 5% but not 7.89%). When you are faced with a 160-seat option (the largest option open to the Constituency Commission), changes to constituency boundaries would now be absolutely necessary in 23% of cases (where level of variance exceeds 7.89%) and would be probable in a further 26% of cases (where level of variance exceeds 5% but not 7.89%). The level of changes required further increases in line with decisions to reduce Dail seat number by even higher levels and for a 153-seat option (the smallest seat number option open to the Constituency Commission), changes to constituency boundaries would now be absolutely necessary in 49% of cases (where level of variance exceeds 7.89%) and would be probable in a further 23% of cases (where level of variance exceeds 5% but not 7.89%).

One interesting point to note is that if the population increase between the 2011 Census and the next census in 2016 proved to be exactly the same as that between 2006 and 2011 the population in the Republic of Ireland would then stand at 4,965,286. Given the requirement in the Constitution that there be one TD for every 30,000 people (a factor that limited the possible reduction in Dail seat for the 2011-12 Constituency Commission revision to a range between 6 and 13, as the smallest number of Dail seats you can have with a population of 4,588,292 is 153), the smallest number of Dail seats that the Commission would be able to choose in the next revision would be 166 based on aprojected 2016 population figure of 4,965,286, which of course is the current seat level in Dail Eireann.

It is also worth noting that based on the cubic root rule, the idea parliament size for a population of 4,588,292 would be…166 seats.

Given the impressively small level of variation between the provisional (based on enumerator returns) and definitive population figures for the constituencies, my earlier posts (which were based on the provisional figures) as to what might happen in relation to decisions to be taken by the Constituency Commission in relation to changes to Dail election boundaries still largely hold true. But I have updated these to take account of the newer, and definitive, Census 2011 population figures. A more detailed version of this post may be viewed at the Ireland After NAMA blog.

Posted in Census2011 definitive figures, Constituency Commission, Constituency information, Election boundaries | Tagged , , | Leave a comment

Thoughts on shape of new general election boundaries if the Constituency Commission opt for a 158-seat Dail

Adrian Kavanagh, 23rd February 2012

A new Constituency Commission report on election boundaries (for general and European elections) is likely to be published some weeks after the final/definitive population by area statistics for Census 2011 are published by the Central Statistics Office on 26th April 2012.

This post will consider what might happen our current constituency configurations if a 158 seat tally was agreed on for the next Dail and in light of the provisional Census 2011 population levels published by the CSO last year. While the Commission has a range of options to choose from between 153 and 160 in terms of seat numbers for the next Dail, the likelihood is they may opt for a seat tally towards the upper range of this as continued population growth may require seat tallies to be constantly changing if they opt for a seat tally at the lower end of this scale. With a referendum pending on the abolition of the Seanad also, this might also persuade the Commission to not take a more radical approach in terms of reducing the number of seats in the Dail.

The key thing that the Commission will be watching for in this review are constituencies whose population per TD ratios fall outside the 5% variance limit – that is, whose population per TD ratios are either more than 5% above, or below, the state average for this (in the case of a 158-seat Dail, the state average would be 28,995 people per TD). In these cases, the Commission must consider whether they need to make changes to the boundaries/seat numbers for these constituencies. On past precedents, they may opt not to make changes if the level of variance is not much higher than this 5% limit (as happened in the case of Cavan Monaghan in both the 2004 and 2007 revisions) but they must make changes if the level of variance exceeds 7.89% – the maximum level of variance permitted by past commissions (Mayo East in the 1983 revisions).

So what might happen to our current constituencies in the light of the decision to reduce the number of Dail seats and the population changes outlined in the provisional 2011 Census population by area figures, if the Commission opt for a 158-seat Dail?

Continue reading →

Posted in Constituency Commission, Constituency information, Election boundaries | Tagged , | Leave a comment

Thoughts on shape of new general election boundaries if the Constituency Commission opt for a 156-seat Dail

Adrian Kavanagh, 21st February 2012

A new Constituency Commission report on election boundaries (for general and European elections) is likely to be published some weeks after the final/definitive population by area statistics for Census 2011 are published by the Central Statistics Office on 26th April 2012.

This post will consider what might happen our current constituency configurations if a 156 seat tally was agreed on for the next Dail and in light of the provisional Census 2011 population levels published by the CSO last year. While the Commission has a range of options to choose from between 153 and 160 in terms of seat numbers for the next Dail, the likelihood is they may opt for a seat tally towards the upper range of this as continued population growth may require seat tallies to be constantly changing if they opt for a seat tally at the lower end of this scale. That said, if the Commission feels that they need to be seen to be making a conscious effort to reduce seat numbers they may well opt to reduce seat numbers by ten and go for a 156-seat Dail.

The key thing that the Commission will be watching for in this review are constituencies whose population per TD ratios fall outside the 5% variance limit – that is, whose population per TD ratios are either more than 5% above, or below, the state average for this (in the case of a 156-seat Dail, the state average would be 29,367 people per TD). In these cases, the Commission must consider whether they need to make changes to the boundaries/seat numbers for these constituencies. On past precedents, they may opt not to make changes if the level of variance is not much higher than this 5% limit (as happened in the case of Cavan Monaghan in both the 2004 and 2007 revisions) but they must make changes if the level of variance exceeds 7.89% – the maximum level of variance permitted by past commissions (Mayo East in the 1983 revisions).

So what might happen to our current constituencies in the light of the decision to reduce the number of Dail seats and the population changes outlined in the provisional 2011 Census population by area figures, if the Commission opt for a 156-seat Dail?

Continue reading →

Posted in Constituency Commission, Constituency information, Election boundaries | Tagged , | 1 Comment

Thoughts on shape of new general election boundaries if the Constituency Commission opt for a 154-seat Dail

Adrian Kavanagh, 21st February 2012

A new Constituency Commission report on election boundaries (for general and European elections) is likely to be published some weeks after the final/definitive population by area statistics for Census 2011 are published by the Central Statistics Office on 26th April 2012.

This post will consider what might happen our current constituency configurations if a 154 seat tally was agreed on for the next Dail and in light of the provisional Census 2011 population levels published by the CSO last year. While the Commission has a range of options to choose from between 153 and 160 in terms of seat numbers for the next Dail, the likelihood is they may opt for a seat tally towards the upper range of this as continued population growth may require seat tallies to be constantly changing if they opt for a seat tally at the lower end of this scale. This scenario has been considered in the previous post, so this post will instead consider what might happen if the Commission were to opt for a number at the lower end of this scale, say 154 seats.

As noted earlier, the key thing that the Commission will be watching for in this review are constituencies whose population per TD ratios fall outside the 5% variance limit – that is, whose population per TD ratios are either more than 5% above, or below, the state average for this (in the case of a 154-seat Dail, the state average would be 29,749 people per TD). In these cases, the Commission must consider whether they need to make changes to the boundaries/seat numbers for these constituencies. On past precedents, they may opt not to make changes if the level of variance is not much higher than this 5% limit (as happened in the case of Cavan Monaghan in both the 2004 and 2007 revisions) but they must make changes if the level of variance exceeds 7.89% – the maximum level of variance permitted by past commissions (Mayo East in the 1983 revisions).

So what might happen to our current constituencies in the light of the decision to reduce the number of Dail seats and the population changes outlined in the provisional 2011 Census population by area figures, if the Commission opt for a 154-seat Dail?

Continue reading →

Posted in Constituency Commission, Constituency information, Election boundaries | Tagged , | 3 Comments